Having real-time information about your expected visitor numbers has always been an advantage, but now it is also a question of safety. You need to be aware of your visitor numbers at all times and be able to control admission and capacity to prepare accordingly.
With our Customer Report, you will be able to have an accurate and always up-to-date prediction based on historical data, weather, holidays, and actual sales numbers and many more data points. You will always know your numbers for the day.
See how your visitor numbers are broken down into customer segments by product types and capacity.
Note that the Customer Report may not align with your Sales Report because it shows you the number of arrivals at your venue, and therefore, all cancelled visits and refunds will not be reflected.
Here is how you can see and filter your reports:
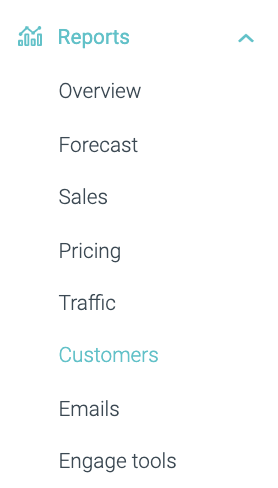
1. Select Customers within the Reports section of your left-hand side menu.
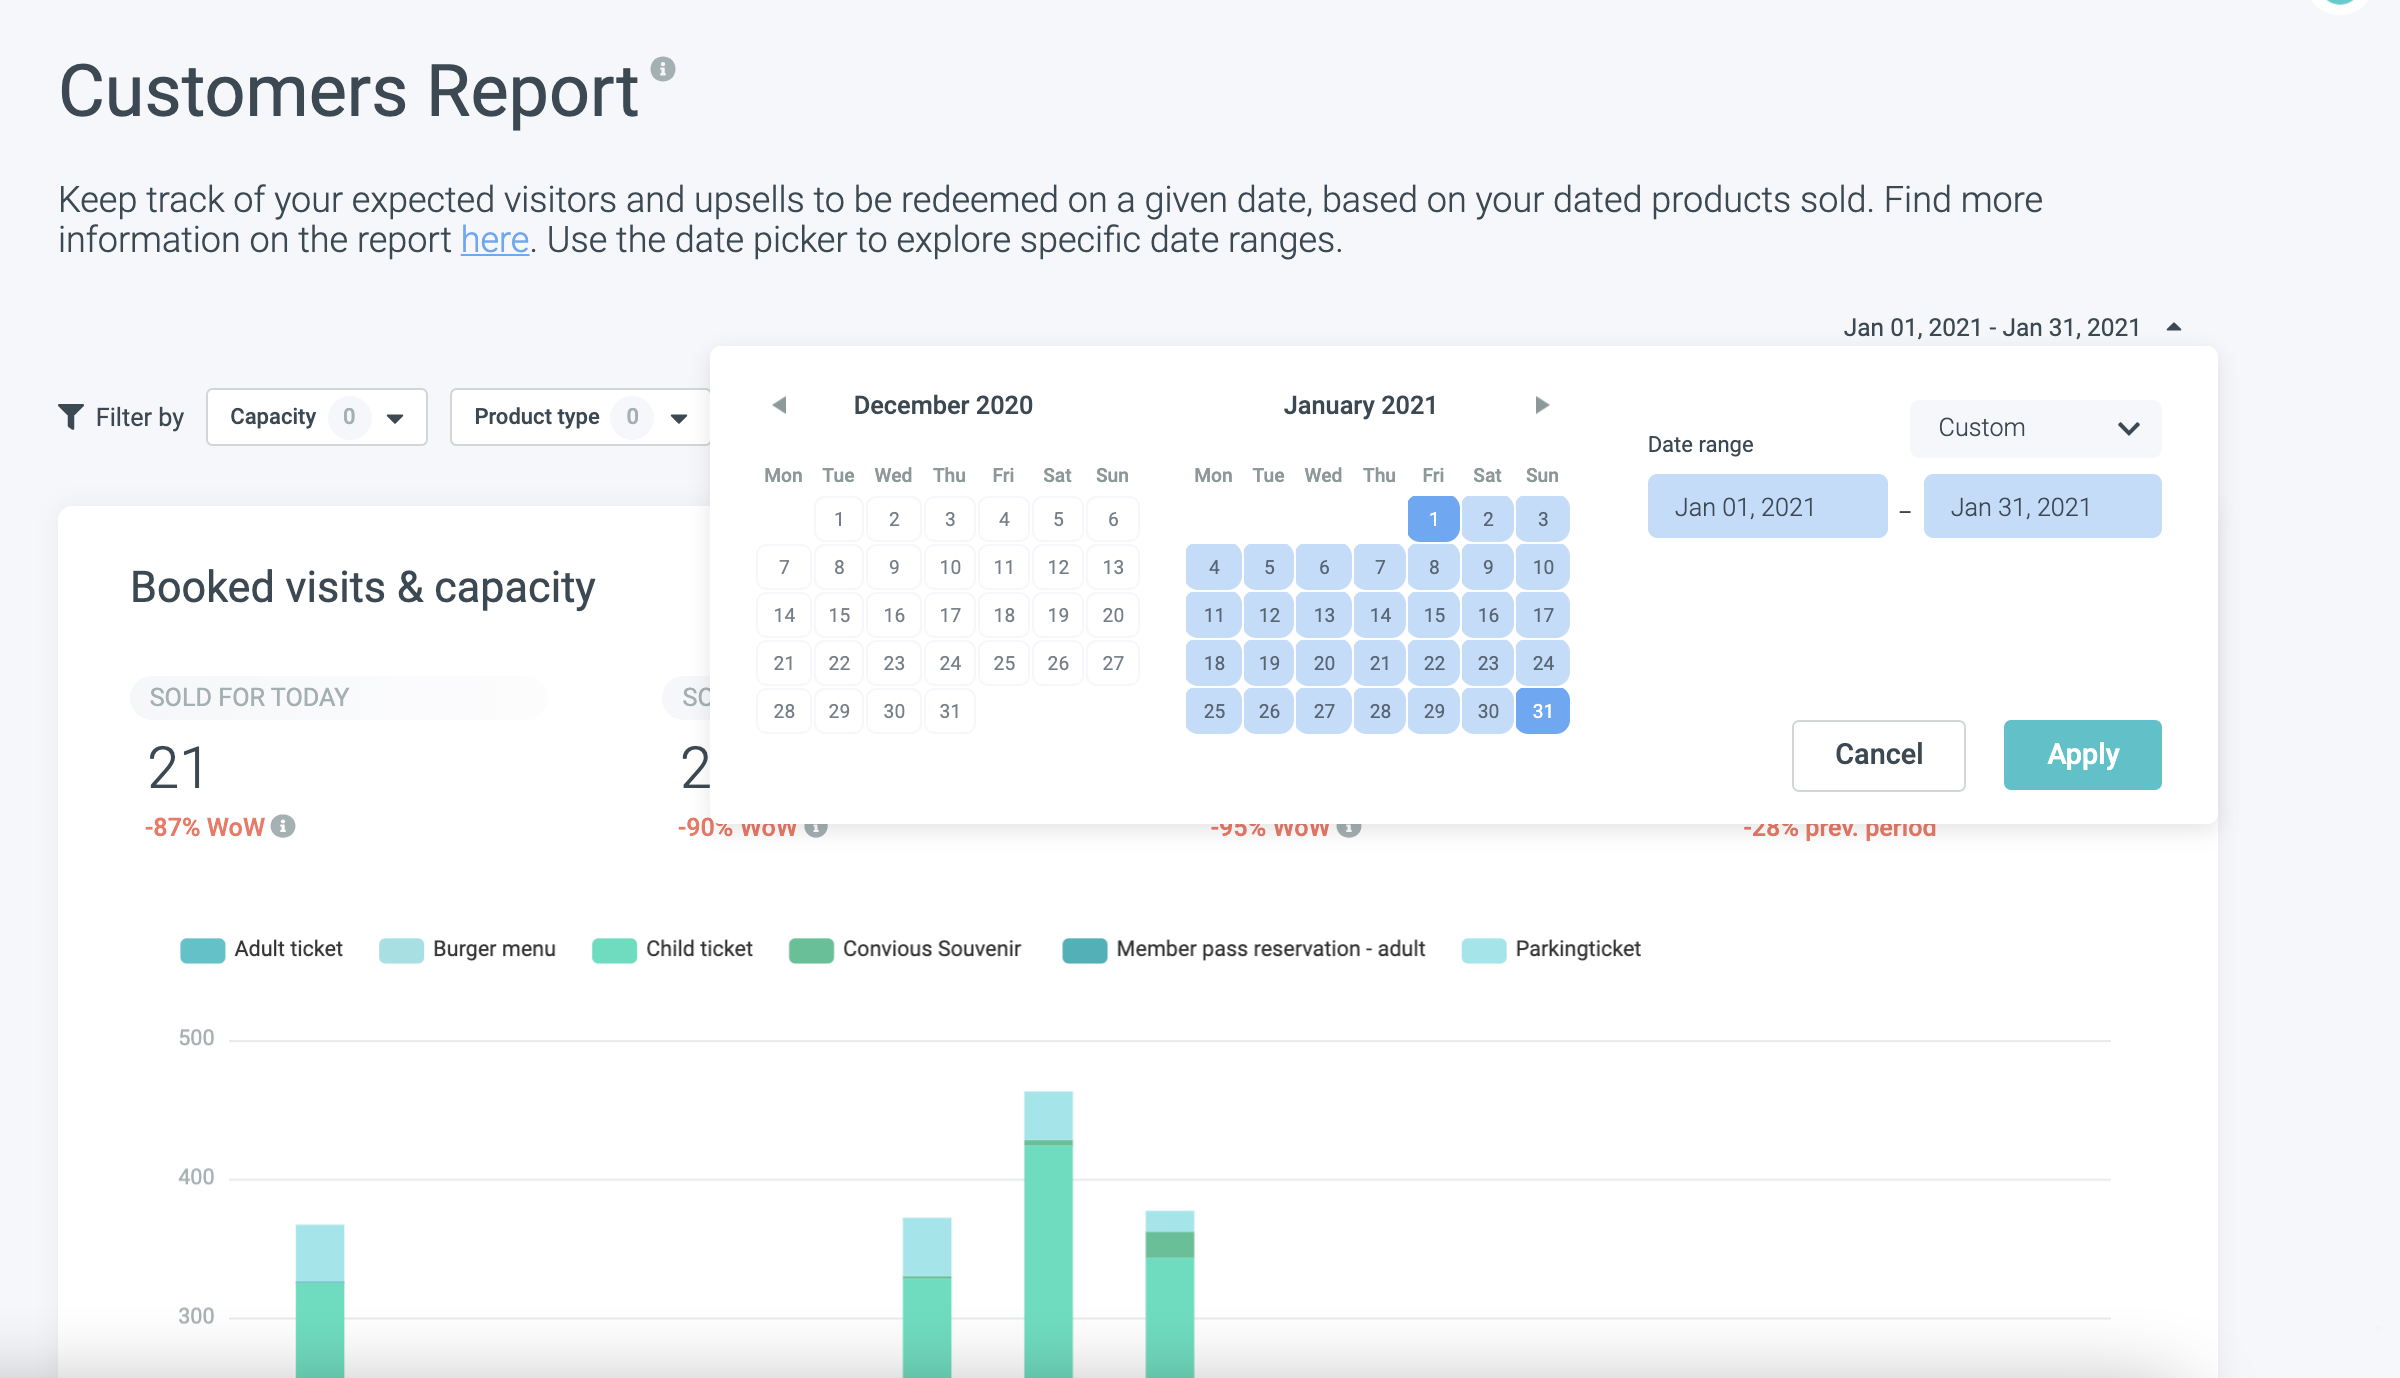
2. Please define the date range that you would like to analyze.
For this example, we will choose the Custom Range of the month of January 2021, but you can also select from predefined ranges.
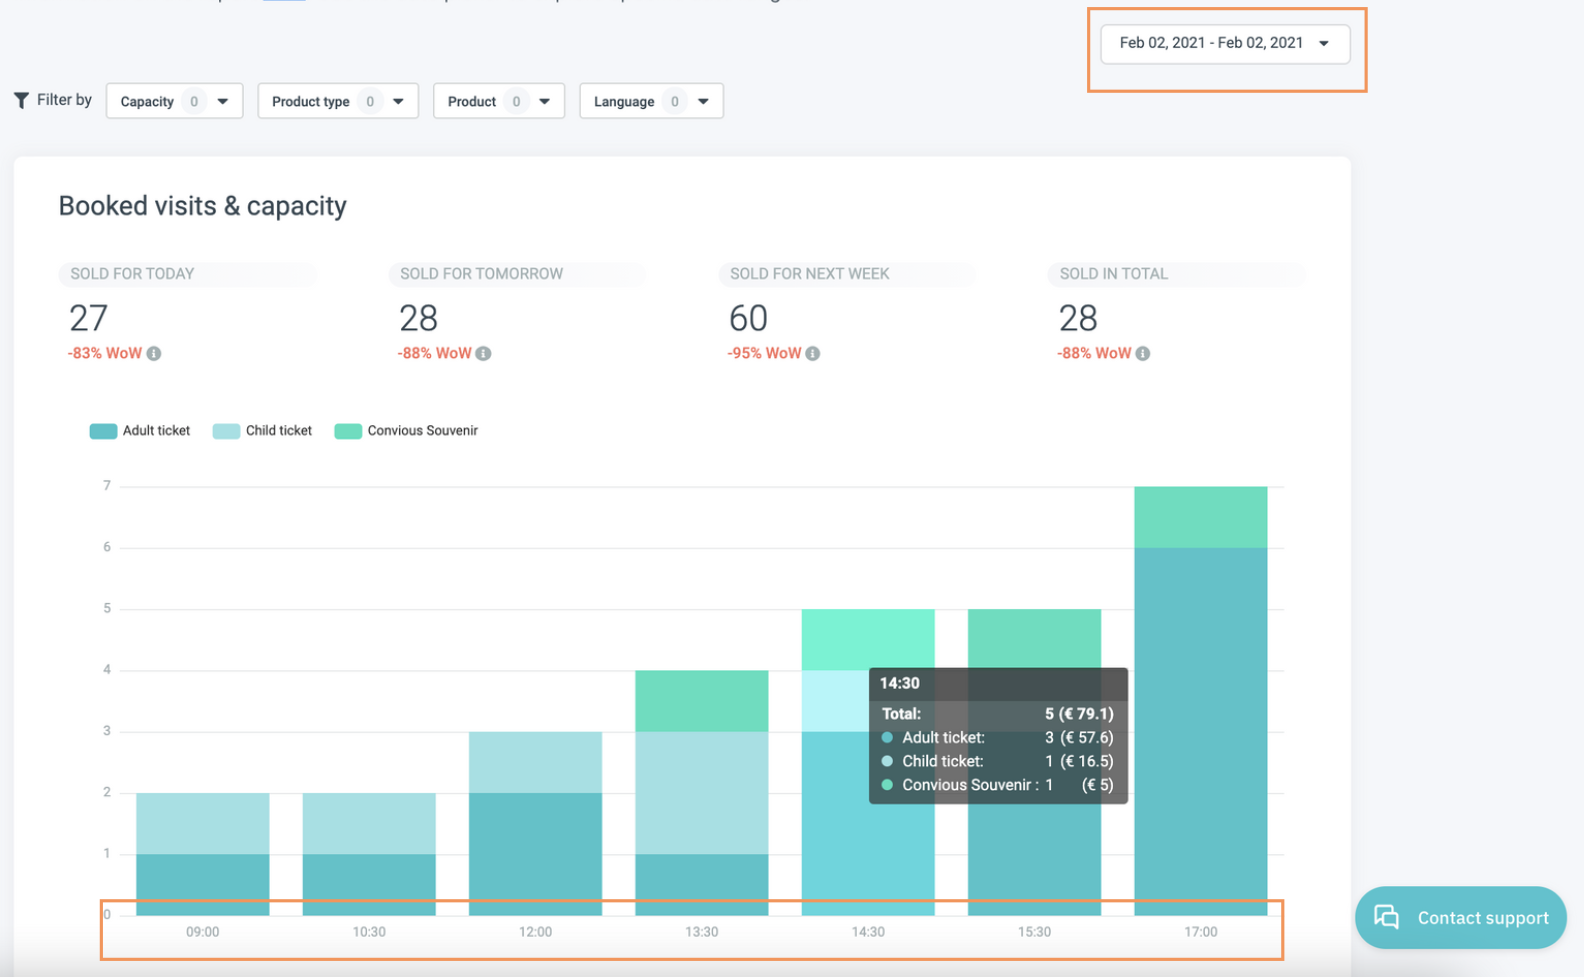
NOTE: if you want to see the breakdown of your products per time slot, choose a single day instead.
3. Now, you need to select the variables you want to look at.
Just like in other reports, to get more detailed insights into your visitors, you can filter your customers by certain variables and cross-reference them to look at commonalities or differences.
In this case, you are able to filter them by Capacity, Product type, Product and Language.
We will walk you through each:
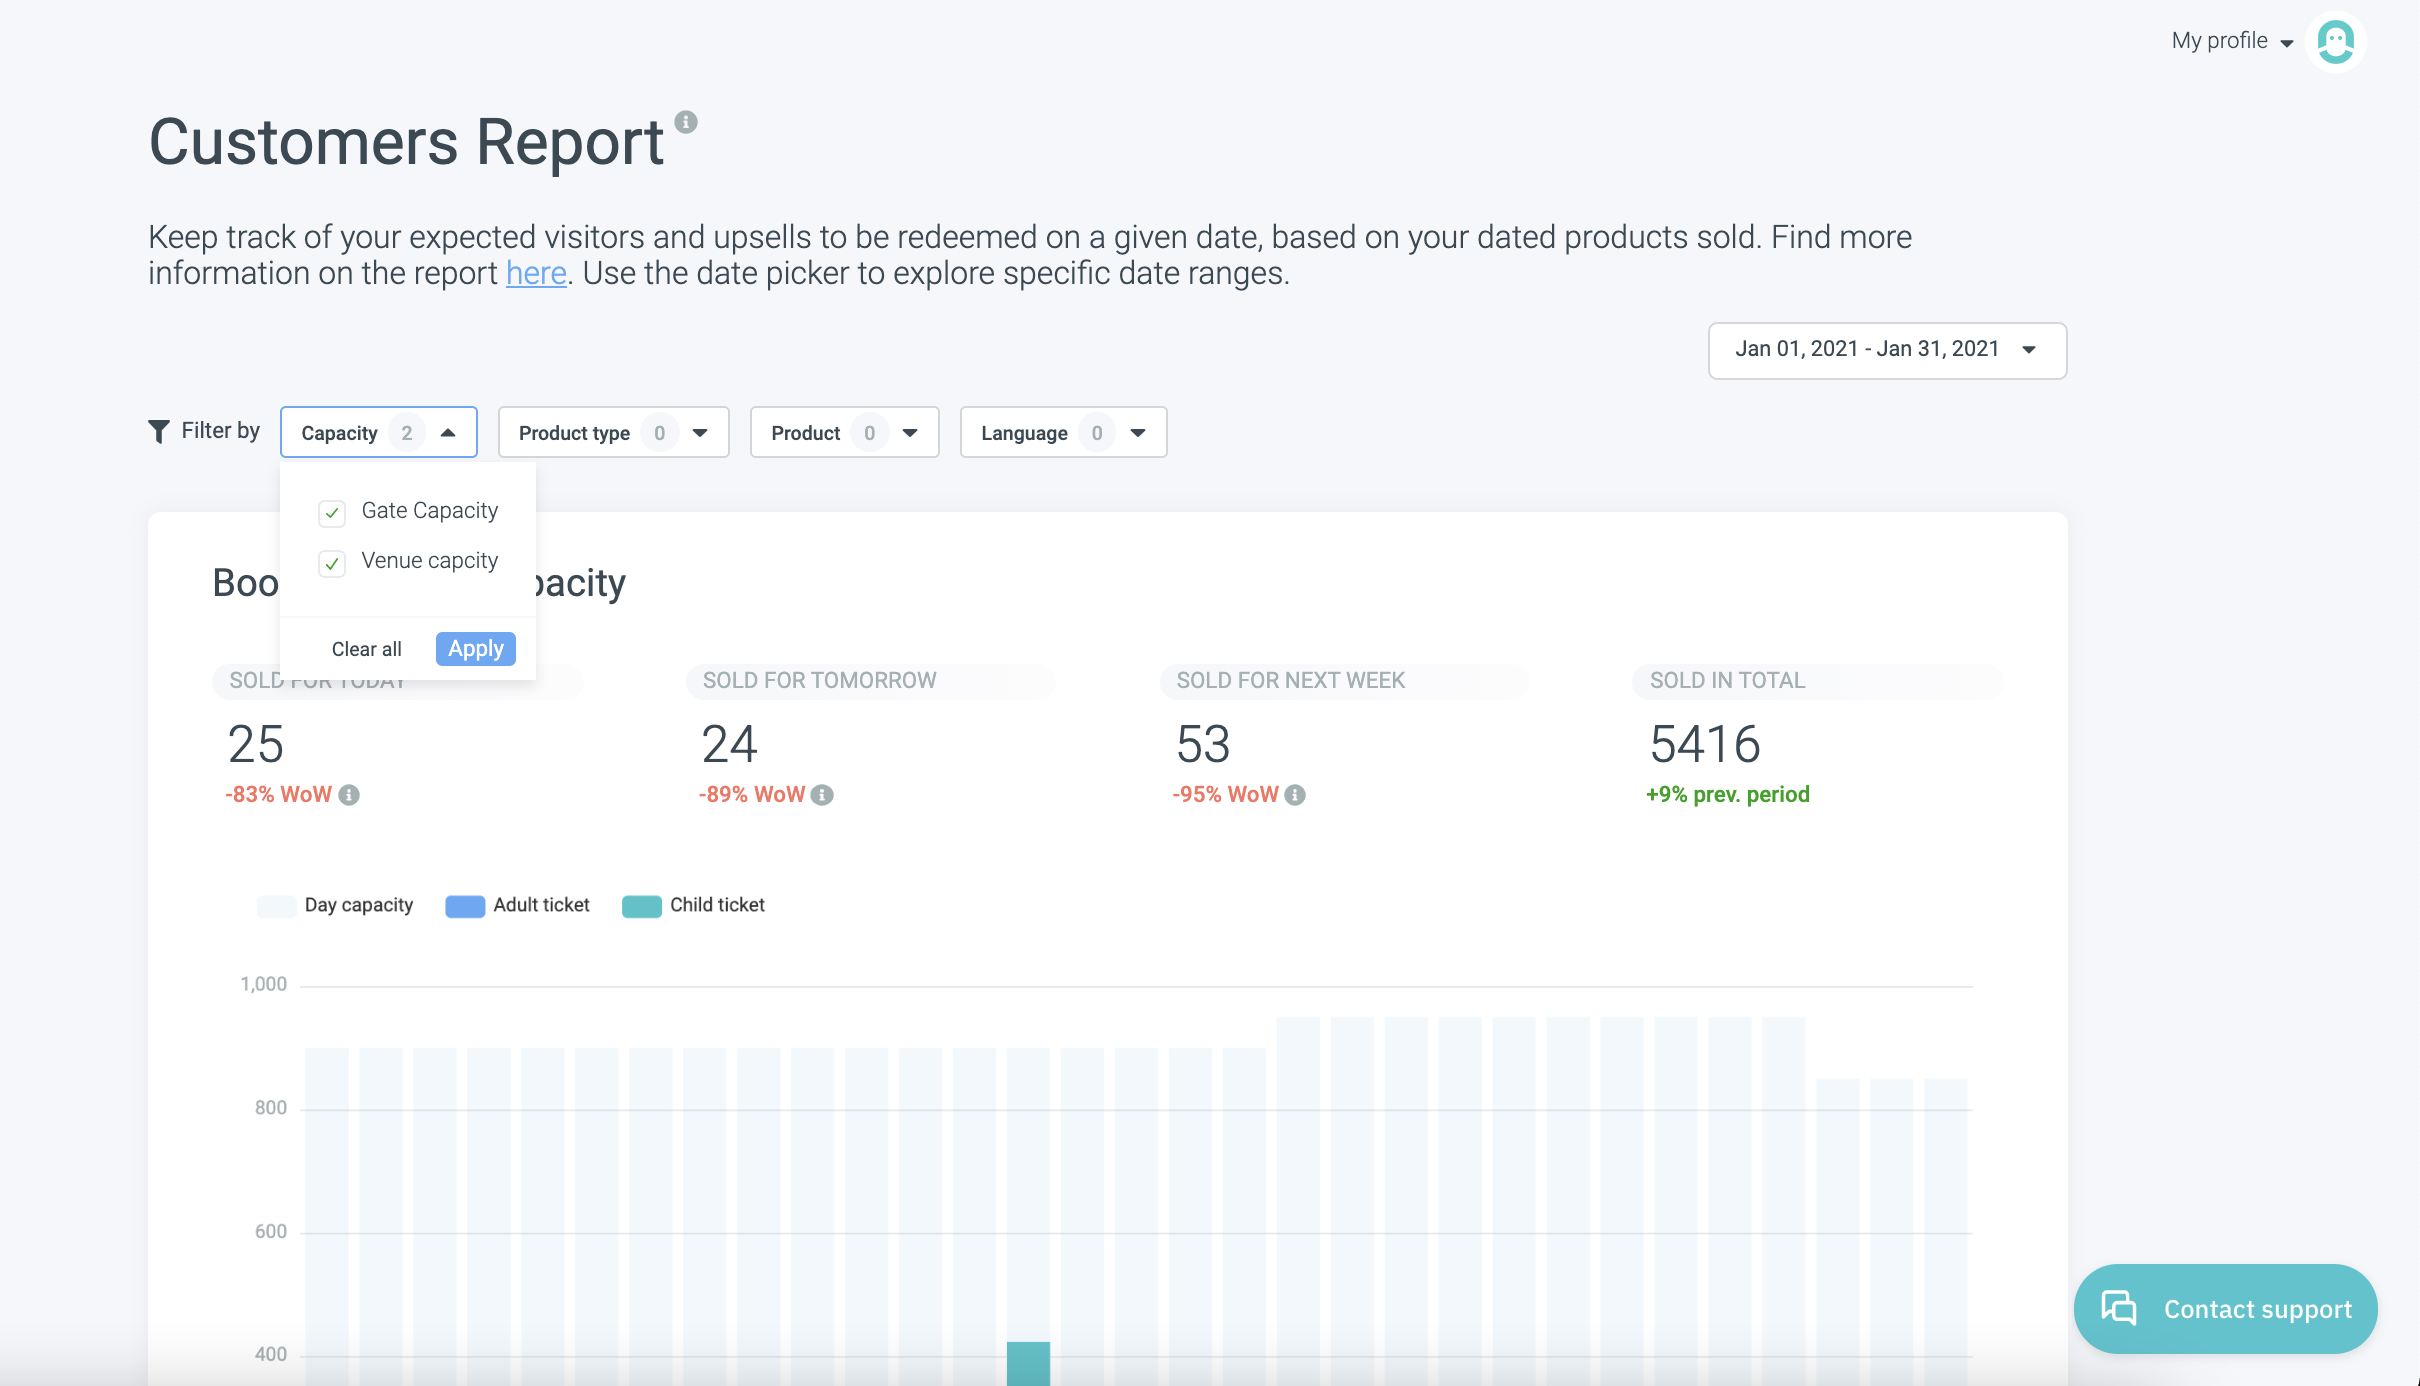
3.1. Choose the capacity or inventory pool.
This is the capacity or inventory groups you have setup.
Do you need a quick refresh on your capacity setup? Visit our article: Inventory, Inventory pools & Set-ups.
For this example, we will view both: venue and gate capacity.
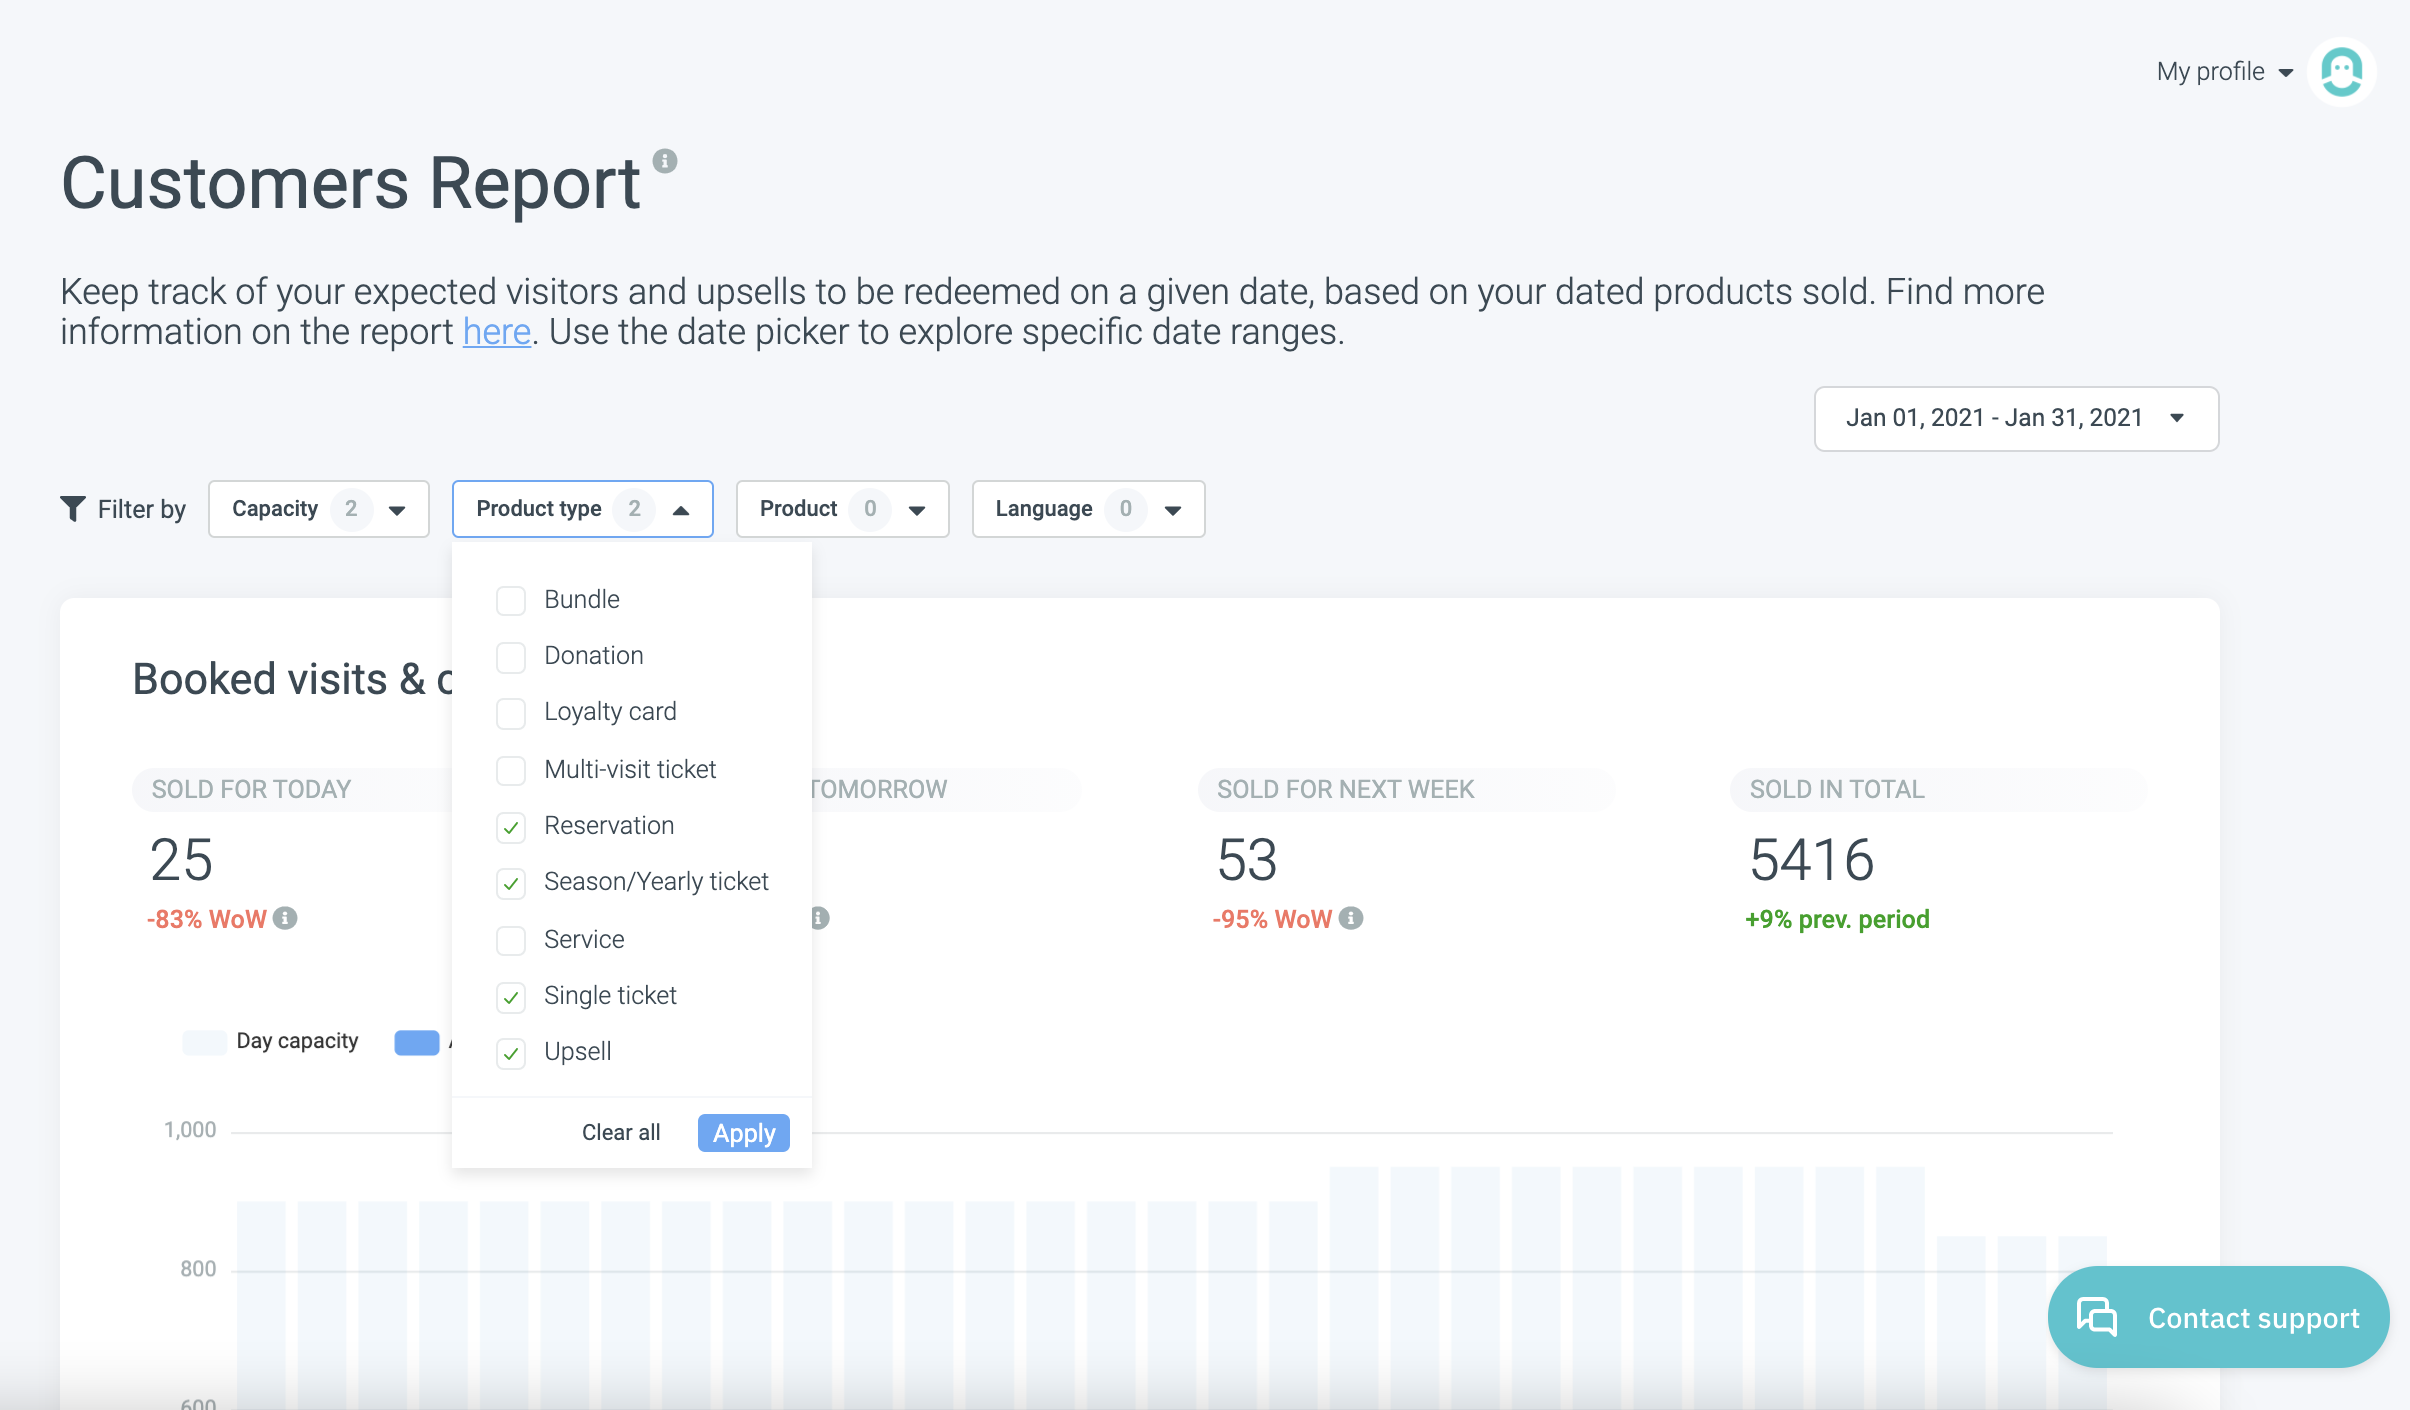
3.2. Choose the product type(s) you want to view.
The product type defines the attributes or function of a product. For example, a Single ticket can only be used once and a Multi-visit ticket can be used multiple times.
For this example, we look at Reservations, Season/Yearly tickets, Single tickets and Upsells.
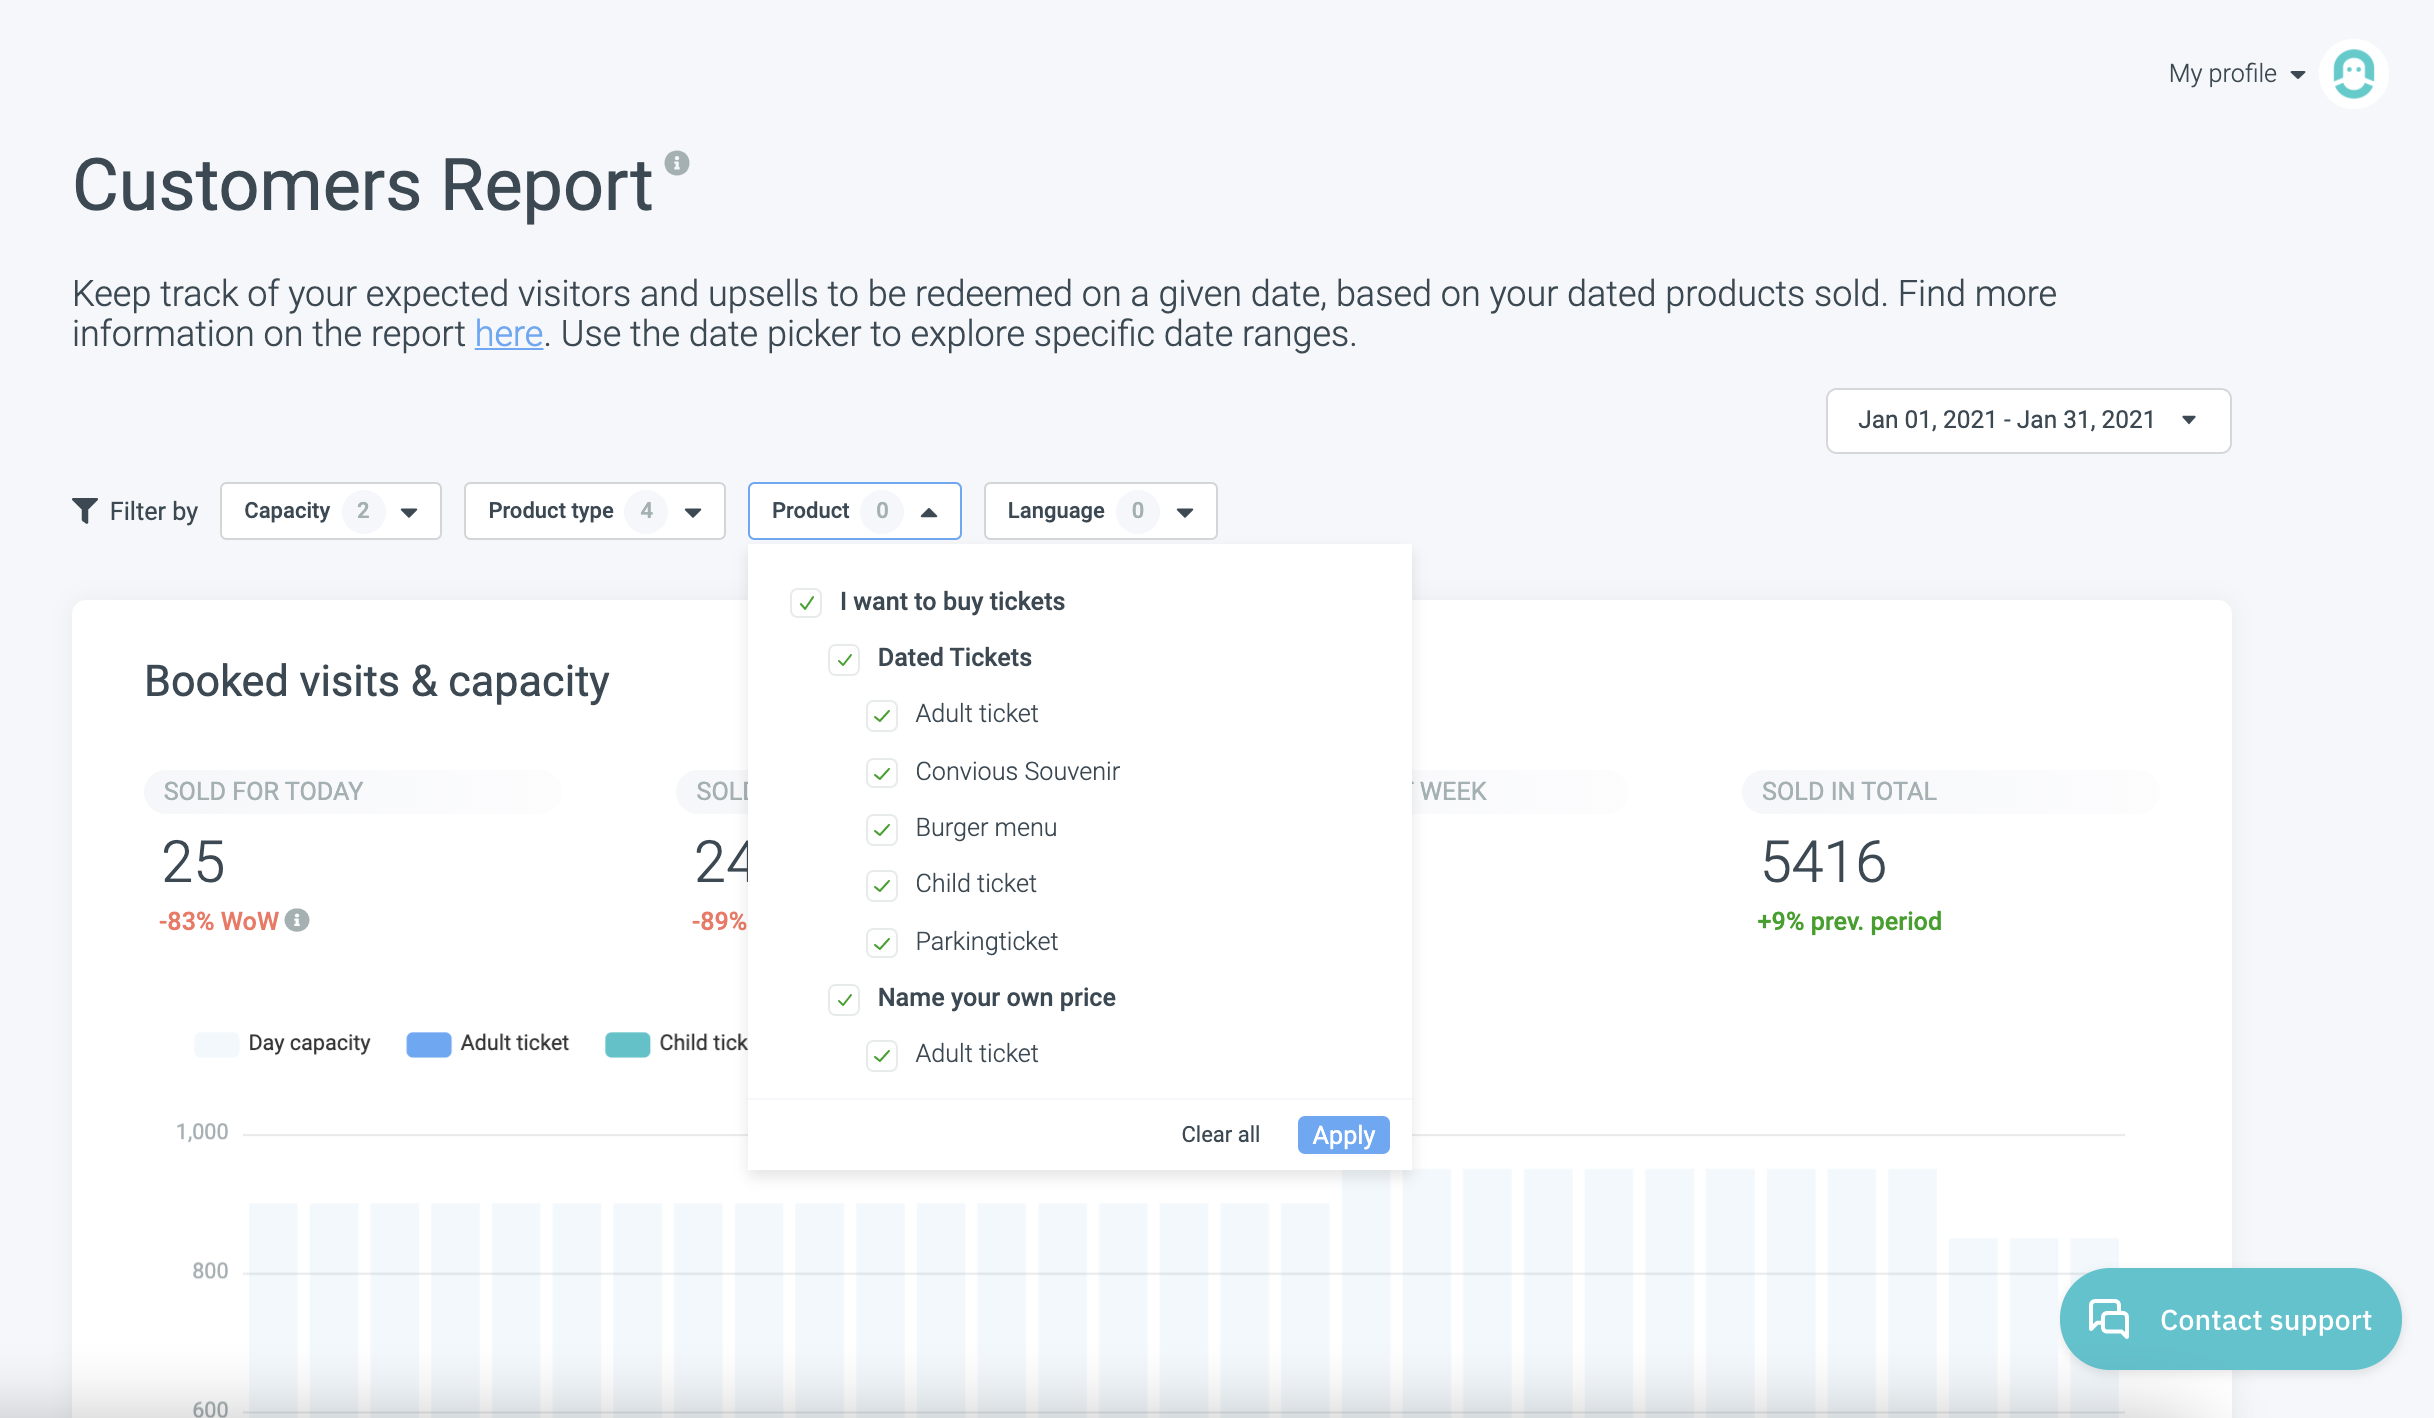
3.3. Choose the Products you want to look at.
The product defines the specific and differing products you offer. For example, you offer adult and children day tickets. These are different products of the same product type. Whereas season passes and Burger menus are different products and different product types.
You can choose products individually or select entire product lists.
Because we want to see Reservations, Season/Yearly tickets, Single tickets and Upsells of everyone who either bought a new ticket or already owned a ticket or a season ticket, we choose those three product lists.
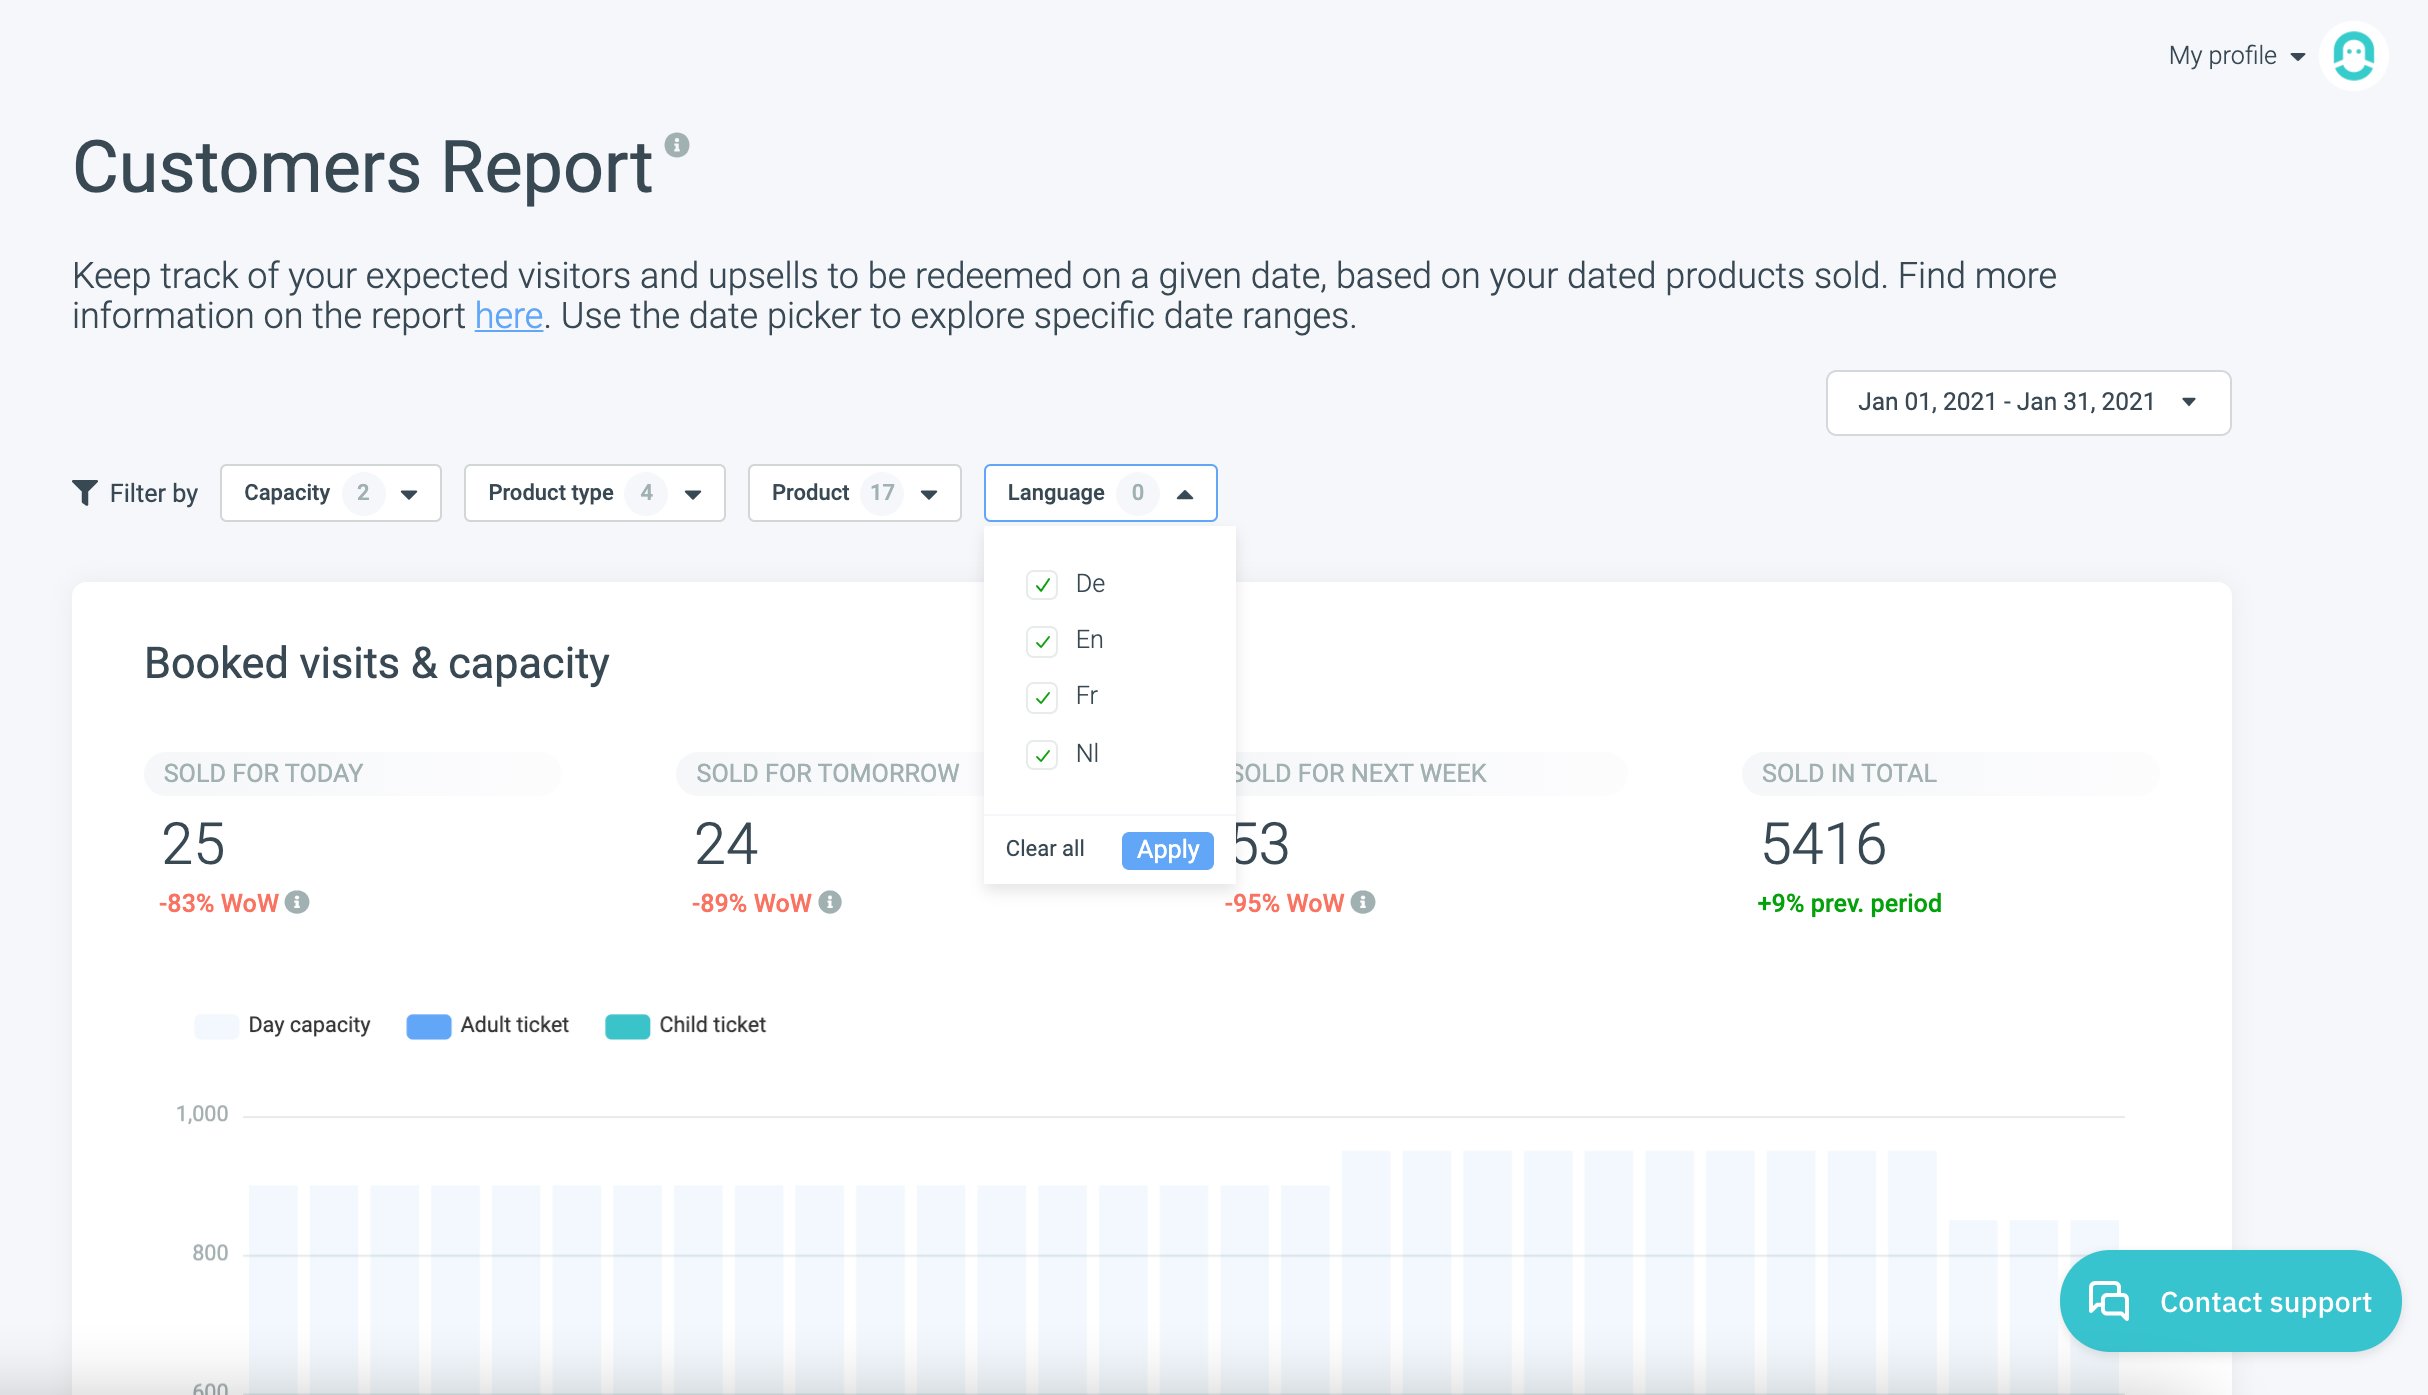
3.4. Choose the Languages you want to include.
This filter uses the language used in the Checkout.
As we want to view customers despite the Checkout language used, we choose all.
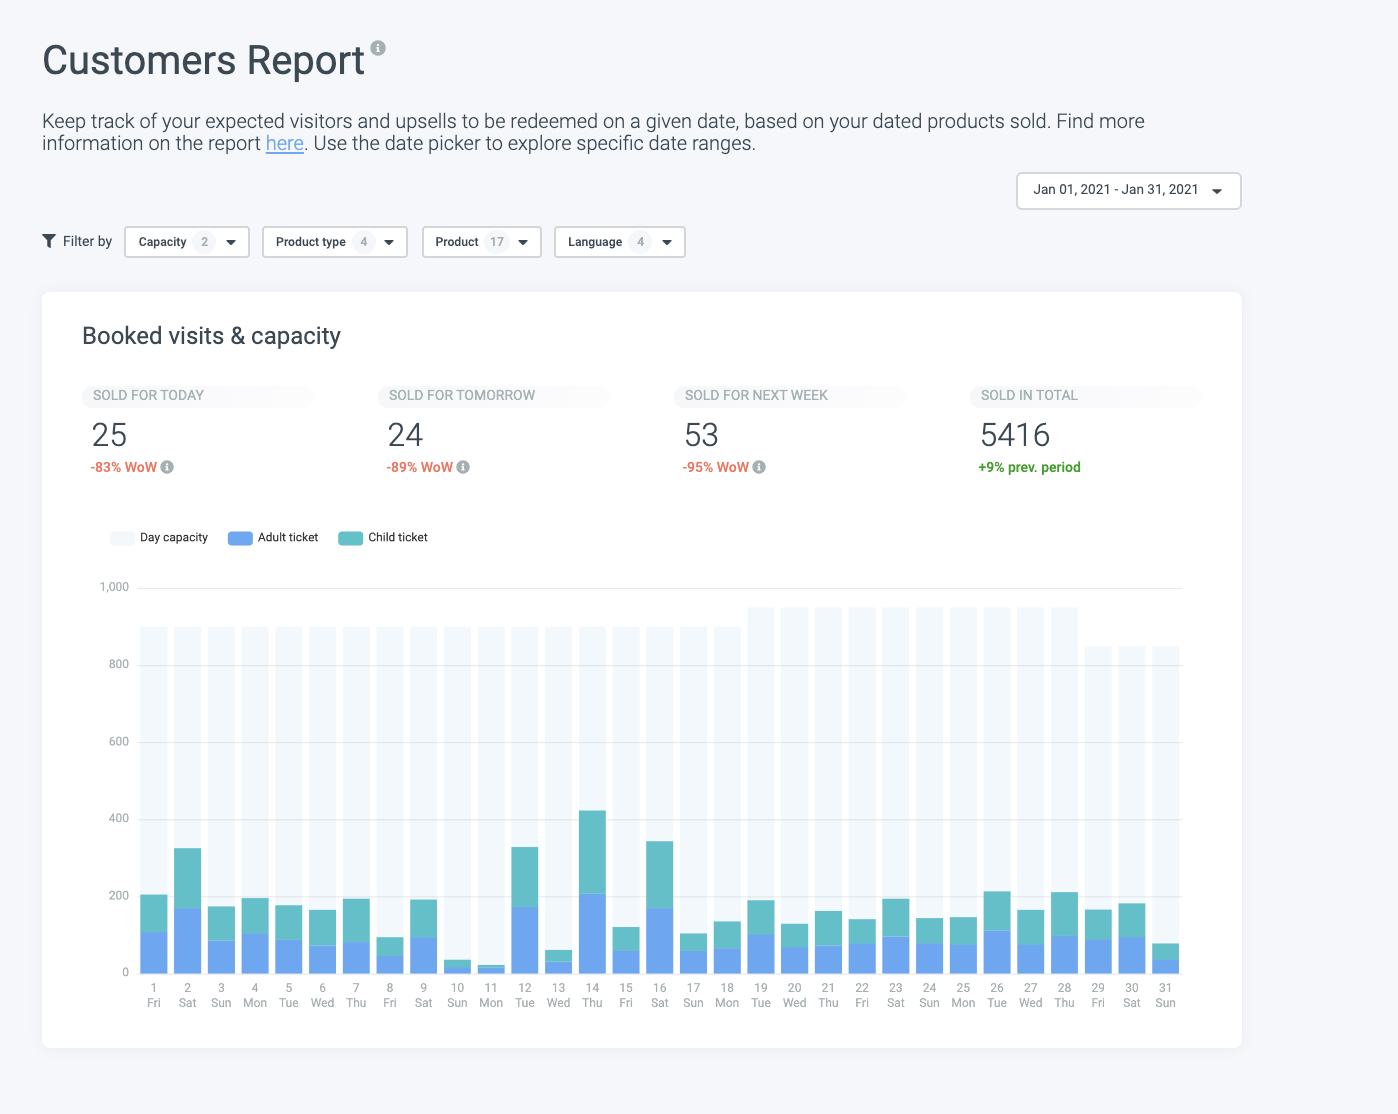
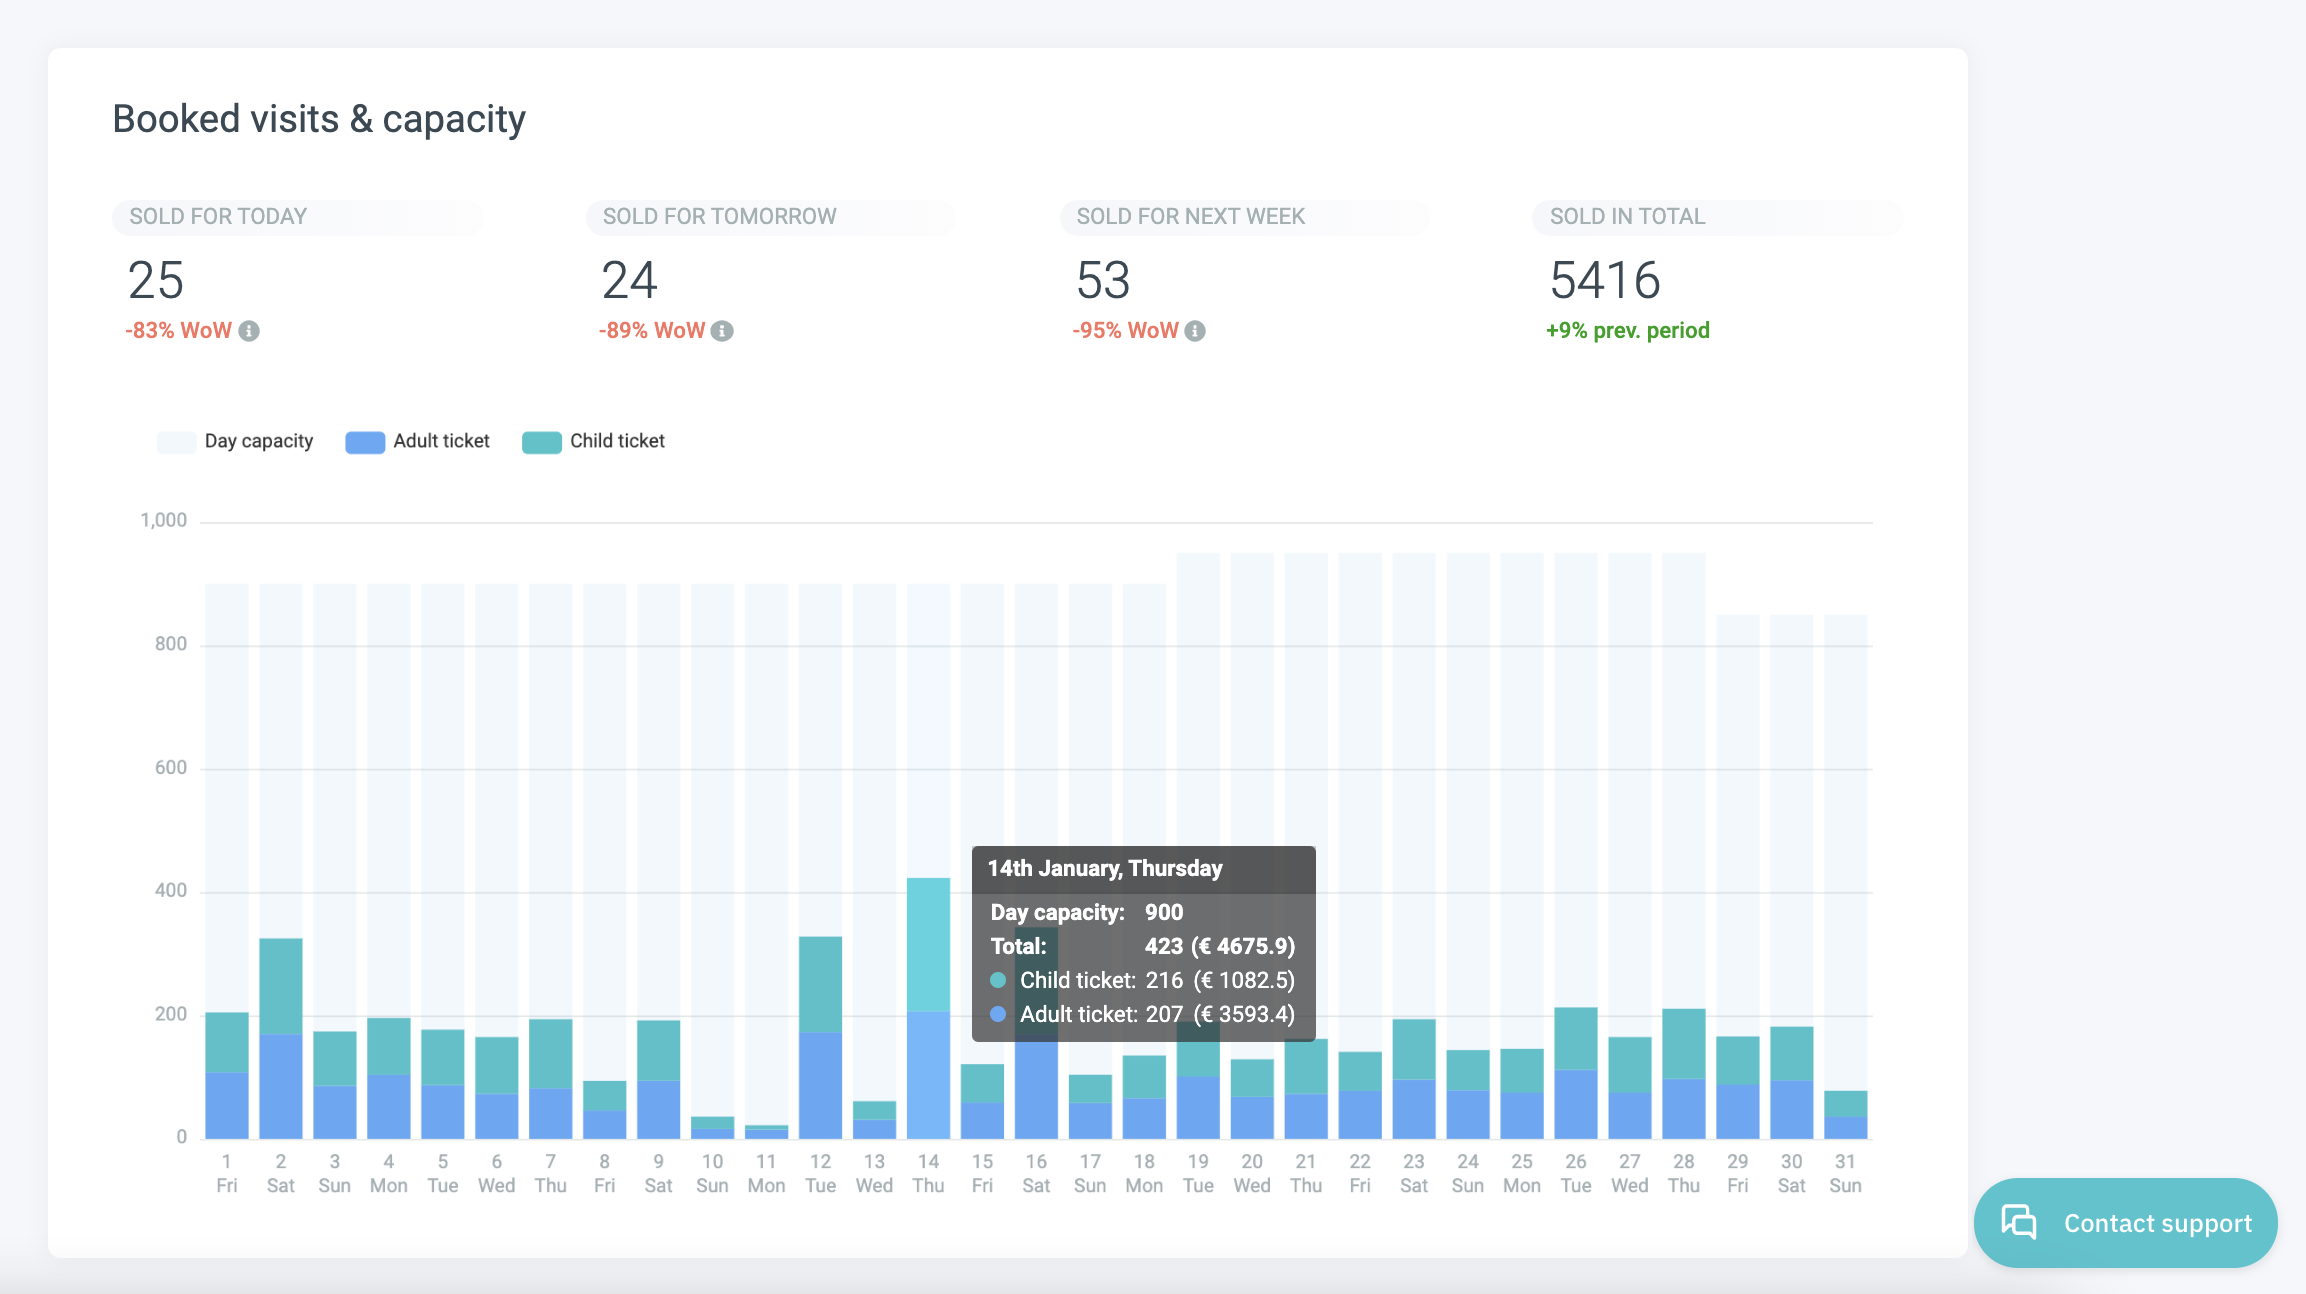
Now you can see your report for the date range and variables you chose:
You will also see the total of the selected products sold, the same products sold today and tomorrow and this number compared Week over Week (= comparing data from one week to the previous week).
Hover over the bars of the cart, to view more details, including a detailed breakdown of how this makes up your capacity and income.
You can cross-reference various variables to gain deep insights into your customers. Maybe you want to see the difference in how many single tickets were booked in combination with an upsell and whether there is a difference in the language used. The report is ready - you choose what to discover!
Bundle items: Please note that those bundle items will be broken down into its individual articles in this report to show the actual amount ( and type) of visitors. For example, A family ticket will be broken down into two adult tickets and two children tickets.
To see the number of bundle items, please head over to the Sales Report.
Keep in mind: Sales and Customers reports cannot be compared.
The Sales Report shows you the number of purchases made on a specific day (or within a specific period of time). The Customers Report indicates the number of visitors for a specific day (or within a specific period of time) = it reflects the visit date.
So if a customer bought a ticket in March to come to visit you in April, his/her ticket will show up in the Sales report of March but not in the Customer Report of March. Instead, it will show in the Customer Report of April, since this is the visit date.
As explained above, the customer report will also not align with your sales report because it shows you the number of arrivals at your venue and therefore, all canceled visits and refunds will not be reflected.
Additionally, bundle items such as family tickets will appear as 1 item in your sales report but reduce capacity by 4 (if the ticket is for 4 people) and thus, display 4 visitors in your Customer Report on the visit date.

