
The Sales Report is all about absolute numbers. Not Euros, Dollars or Pounds, but your actual sales numbers. This is where you will see the number of transactions and the number of products sold broken down by the different variables.
Here are the insights you get from the Sales Report:
- find selling patterns in days, weeks and months
- deepen your understanding of your customer by understanding their preferred devices and payment types
- optimize your website to your best acquisition channels
Note that the Sales Report may not align with your Customers Report because it shows all sales, including cancelled visits and refunds. The total numbers of cancelled visits and refunds are shown in the overview table at the end of the page. However, neither will be reflected in the Customers Report as it shows the number of arrivals at your venue.
Skip to your your Sales/Revenue breakdown report
How to use the Sales Report:
1. Select Sales within the Reports section of your left-hand side menu
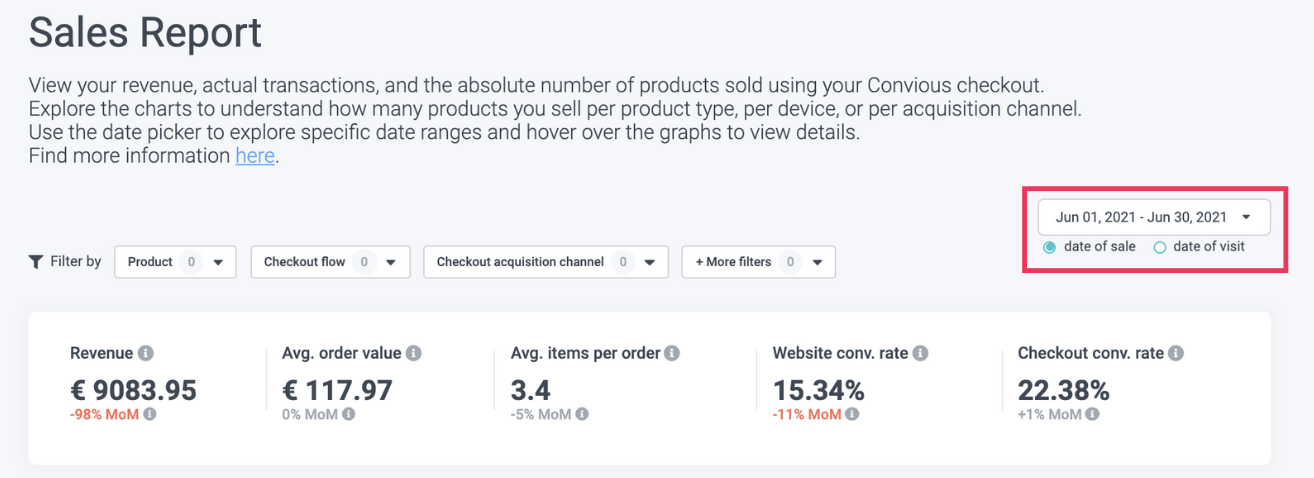
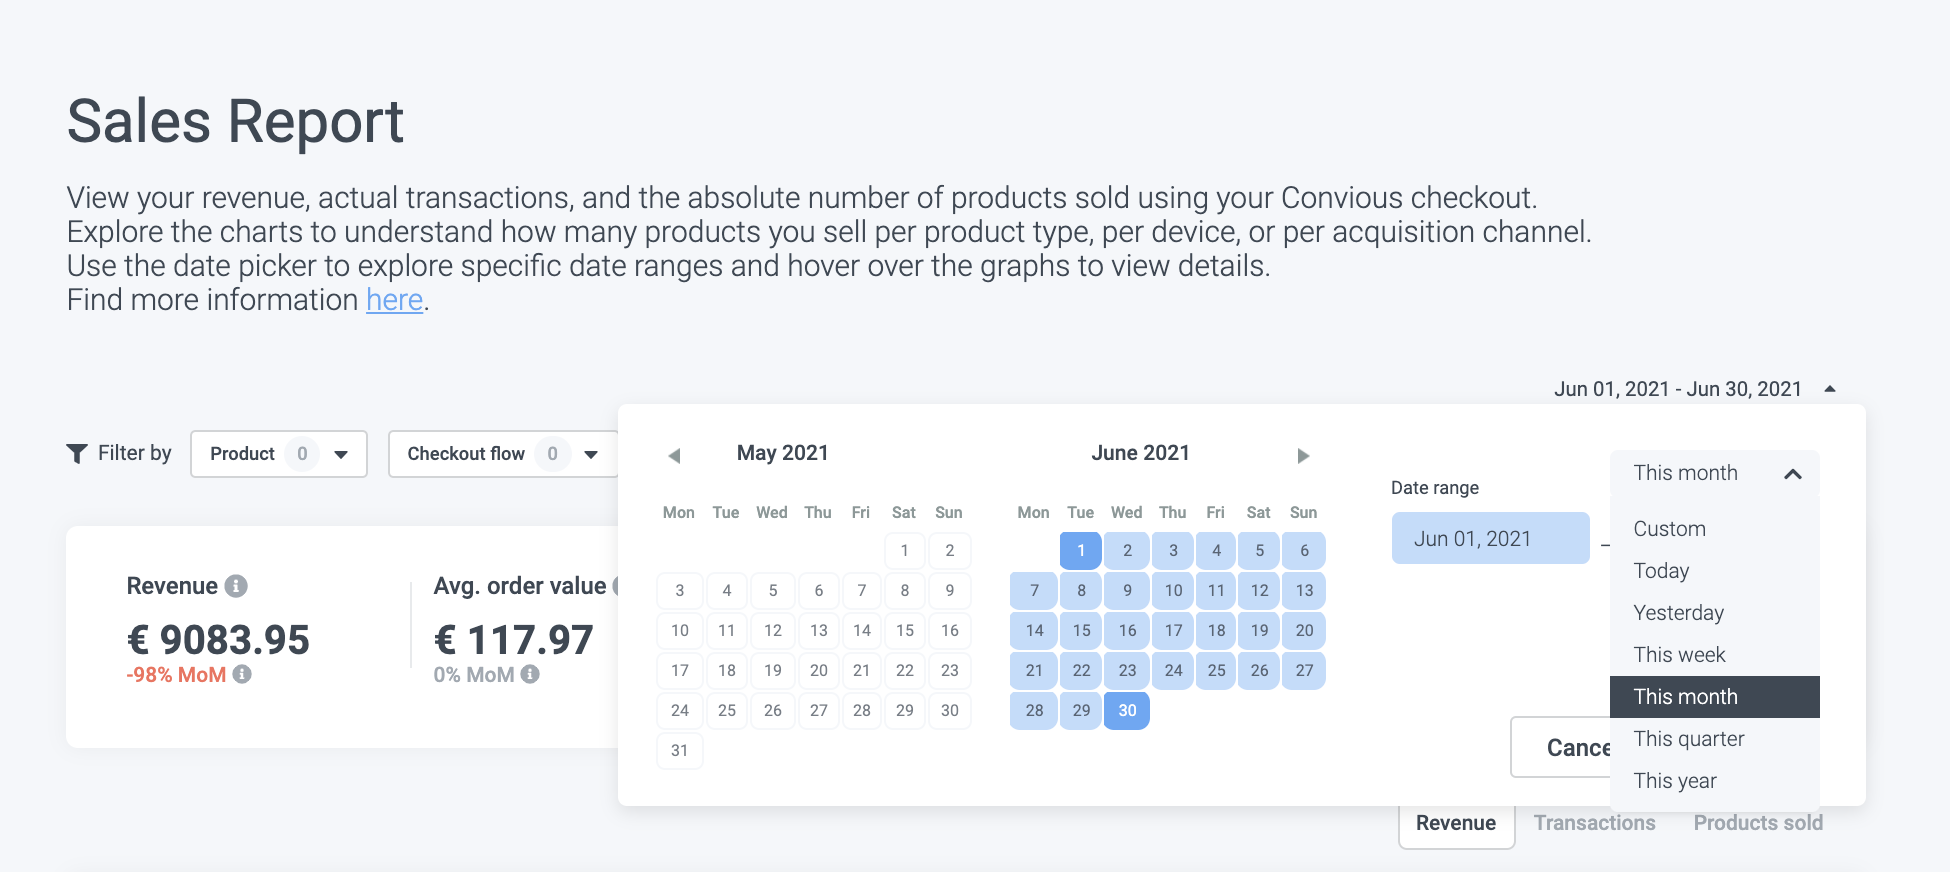
2. Define the date range that you would like to analyze.
3. Or, if you prefer, select from predefined ranges
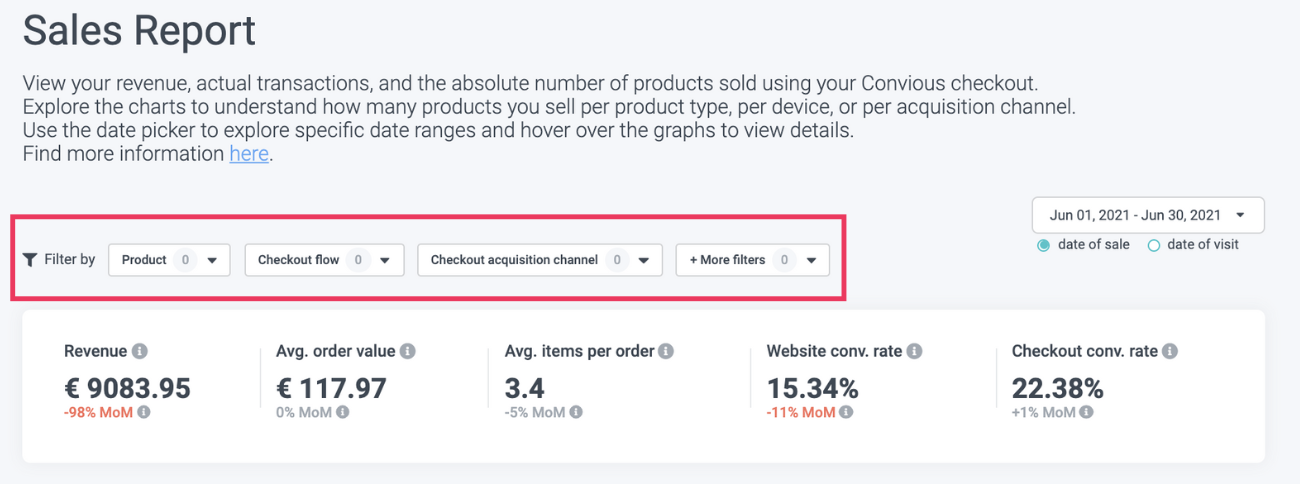
4. Choose which filters you want to apply. You have the option to choose between:
- Products or entire categories: This includes all your articles or products you have available in your Checkout. Including upsells.
- Checkout flows: Sales flows and reservation flows.
- Acquisition channels: This defines the tool that your customer interacted with to make the transaction, including direct, email, modal window, Tap, Trigger Button or the WonderBar.
- Traffic acquisition channels: This defines the channels that your customer who made the transaction came from, including direct, direct via Tap, email, organic search, other, paid display, paid search, paid social or social.
- Device type: This defines the device your customer used at the point of purchase, including mobile, desktop or other.
- Payment methods: This defines the payment method used for the transaction and depends on your setup payment methods.
- Language: This indicates the language the Checkout was used in and depends on your setup languages.
- Sales channels: If you have the reseller module enabled, you can filter by reseller.
After applying the filter, you can immediately see the revenue, the average order value, the average items per order, the website conversion rate and the Checkout conversion rate. You can see the total number as well as a percentage indicating the difference compared to a pervious period of the same length.
In this case, we choose adult tickets. We see, for example, that the revenue generated through adult tickets is 119.k but -60% compared to the month before.
Different from the reports at the bottom of this reports page, the filters allow you to choose, combine, and cross the variables that are of interest to you.
Do you wanna know how many parking ticket transactions were made from a mobile device? Or how many transactions were completed using Paypal? Sounds difficult but it is now so easy!
5. Below, you can also click through a detailed view of your revenue, transactions, and products sold for this defined time period with the menu at the top right.
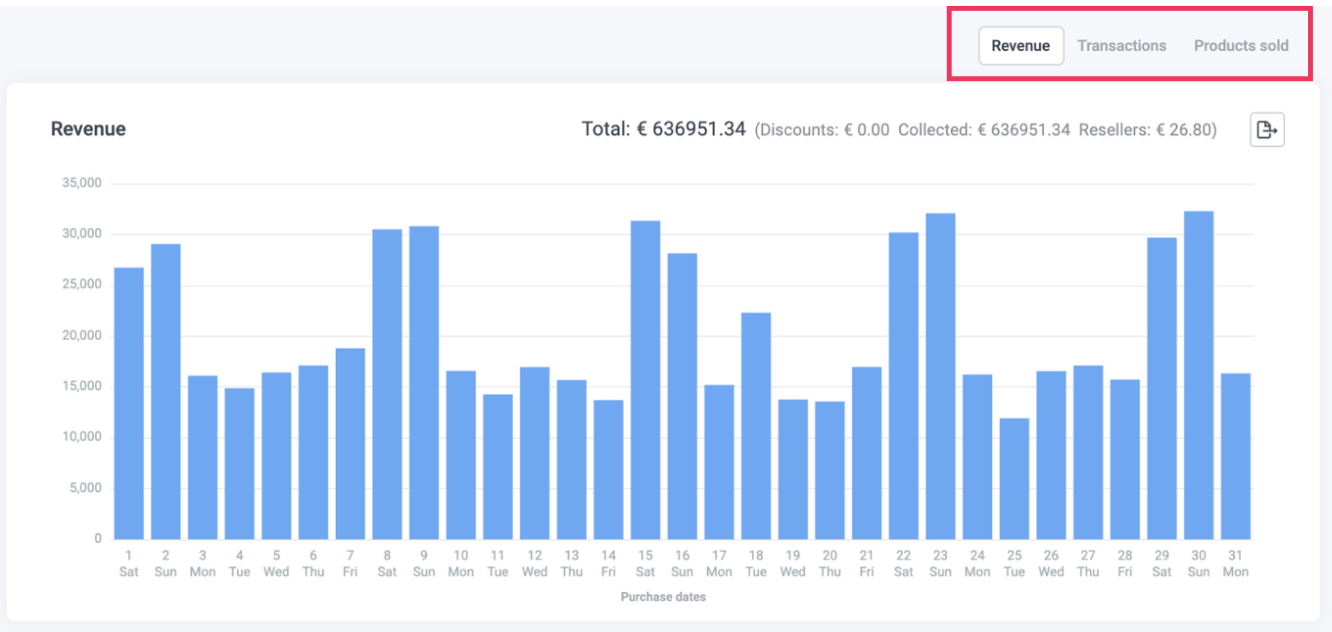
Revenue:
See the gross revenue generated from the tickets, gift cards, order changes, and other products sold via your Convious Checkout. Discover which products contribute the most to your overall revenue.
Transactions:
See how many transactions were made each day or, in this case, each month. Recognize behavioural trends and improve your overall conversion.
Products sold:
See how many products you’ve sold each day. See the corrections between the days and products purchased or understand how the revenue comes to be.
Please note that bundle items will be shown as one item and not be broken down into its individual articles in the Sales report. If you want to see the actual visitor numbers, please head over to your Customer Report.

Exports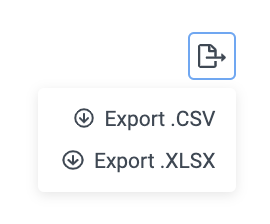
Every graph or chart that shows this icon can be exported either as .CSV or as Excel file.
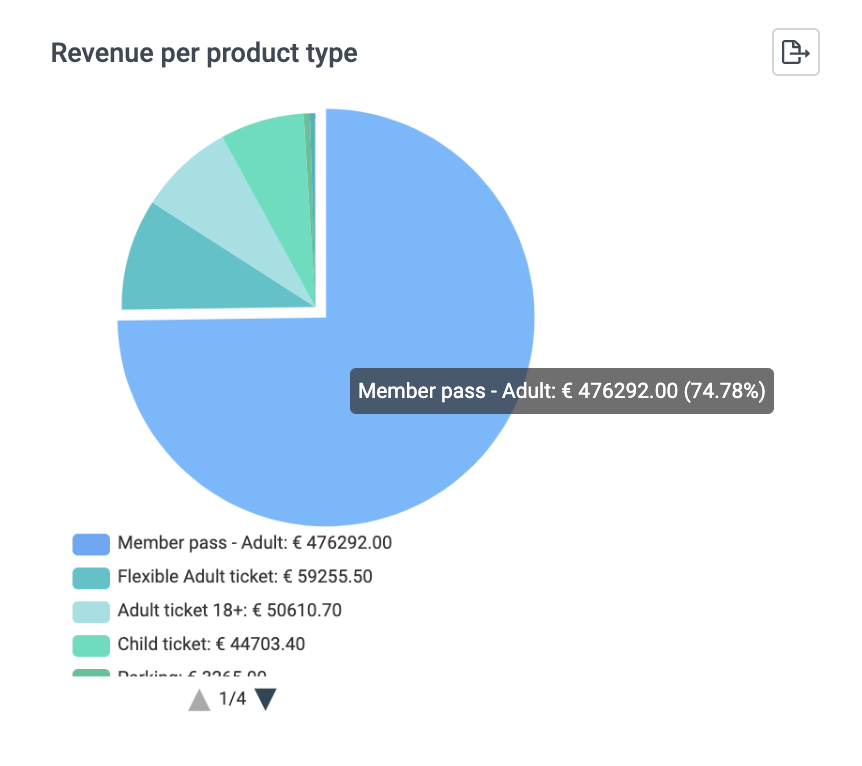
Pie charts
Revenue per product type
If you have no filter set, this shows you the breakdown generated revenue of all your product types. If you have selected certain products, then it will only show you the product types involved. Hover over the chart to see the € and % per product type.
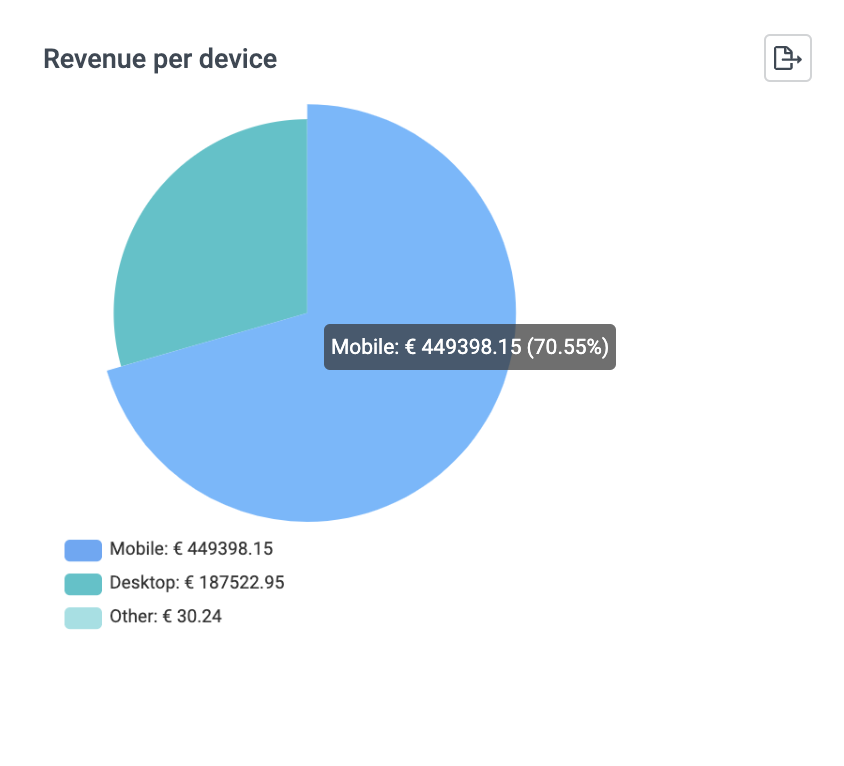
Revenue per device
This pie chart shows you how much revenue you generated per specific device type. These can be mobile, desktop, or other. Hover over the chart to see the € and % per device.
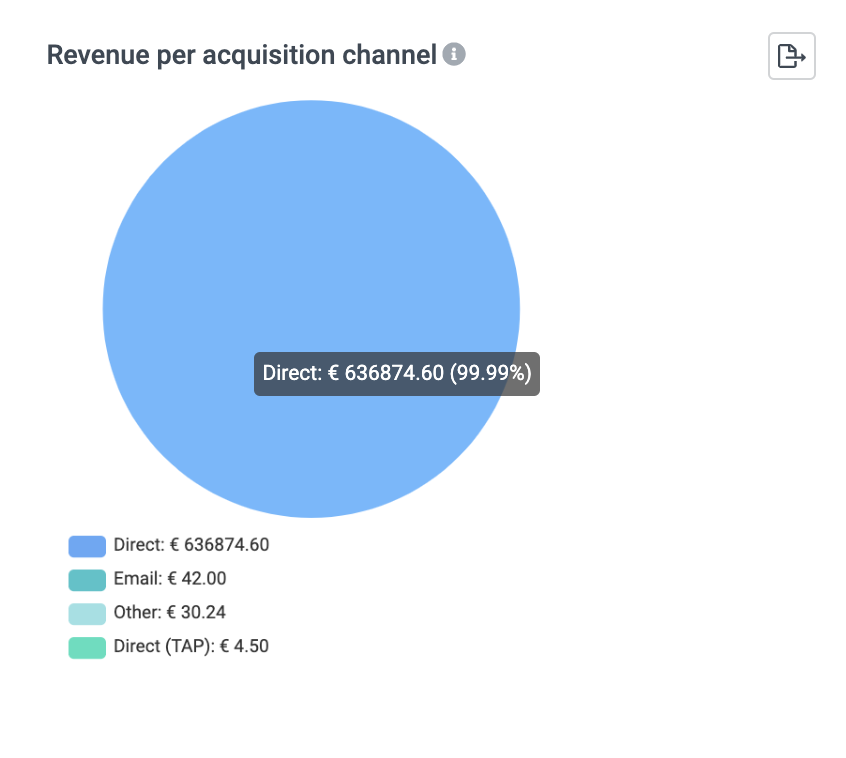
Revenue per acquisition channel
This shows you how much you’ve sold through each acquisition channel. Hover over the chart to see the € and % per channel.
Acquisition channels displayed in the report usually include:
Organic: users that searched and found your page in a search engine
Paid Display: users that clicked a paid ad
Paid Search: users that clicked a paid ad in a search engine
Paid Social: users that clicked a paid ad in a social media
Direct: users that typed your address in the address bar
Other: all other possible channels aggregated
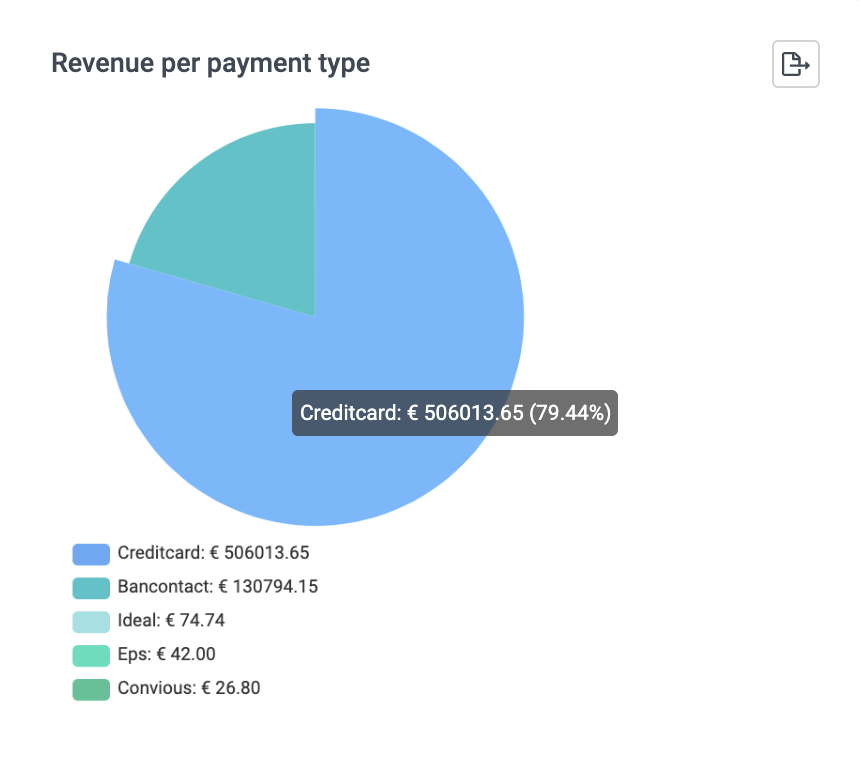
Revenue per payment type
A pie chart that shows you how much revenue was generated per each payment method that is enabled in your Checkout. Hover over the chart to see the € and % per payment type.
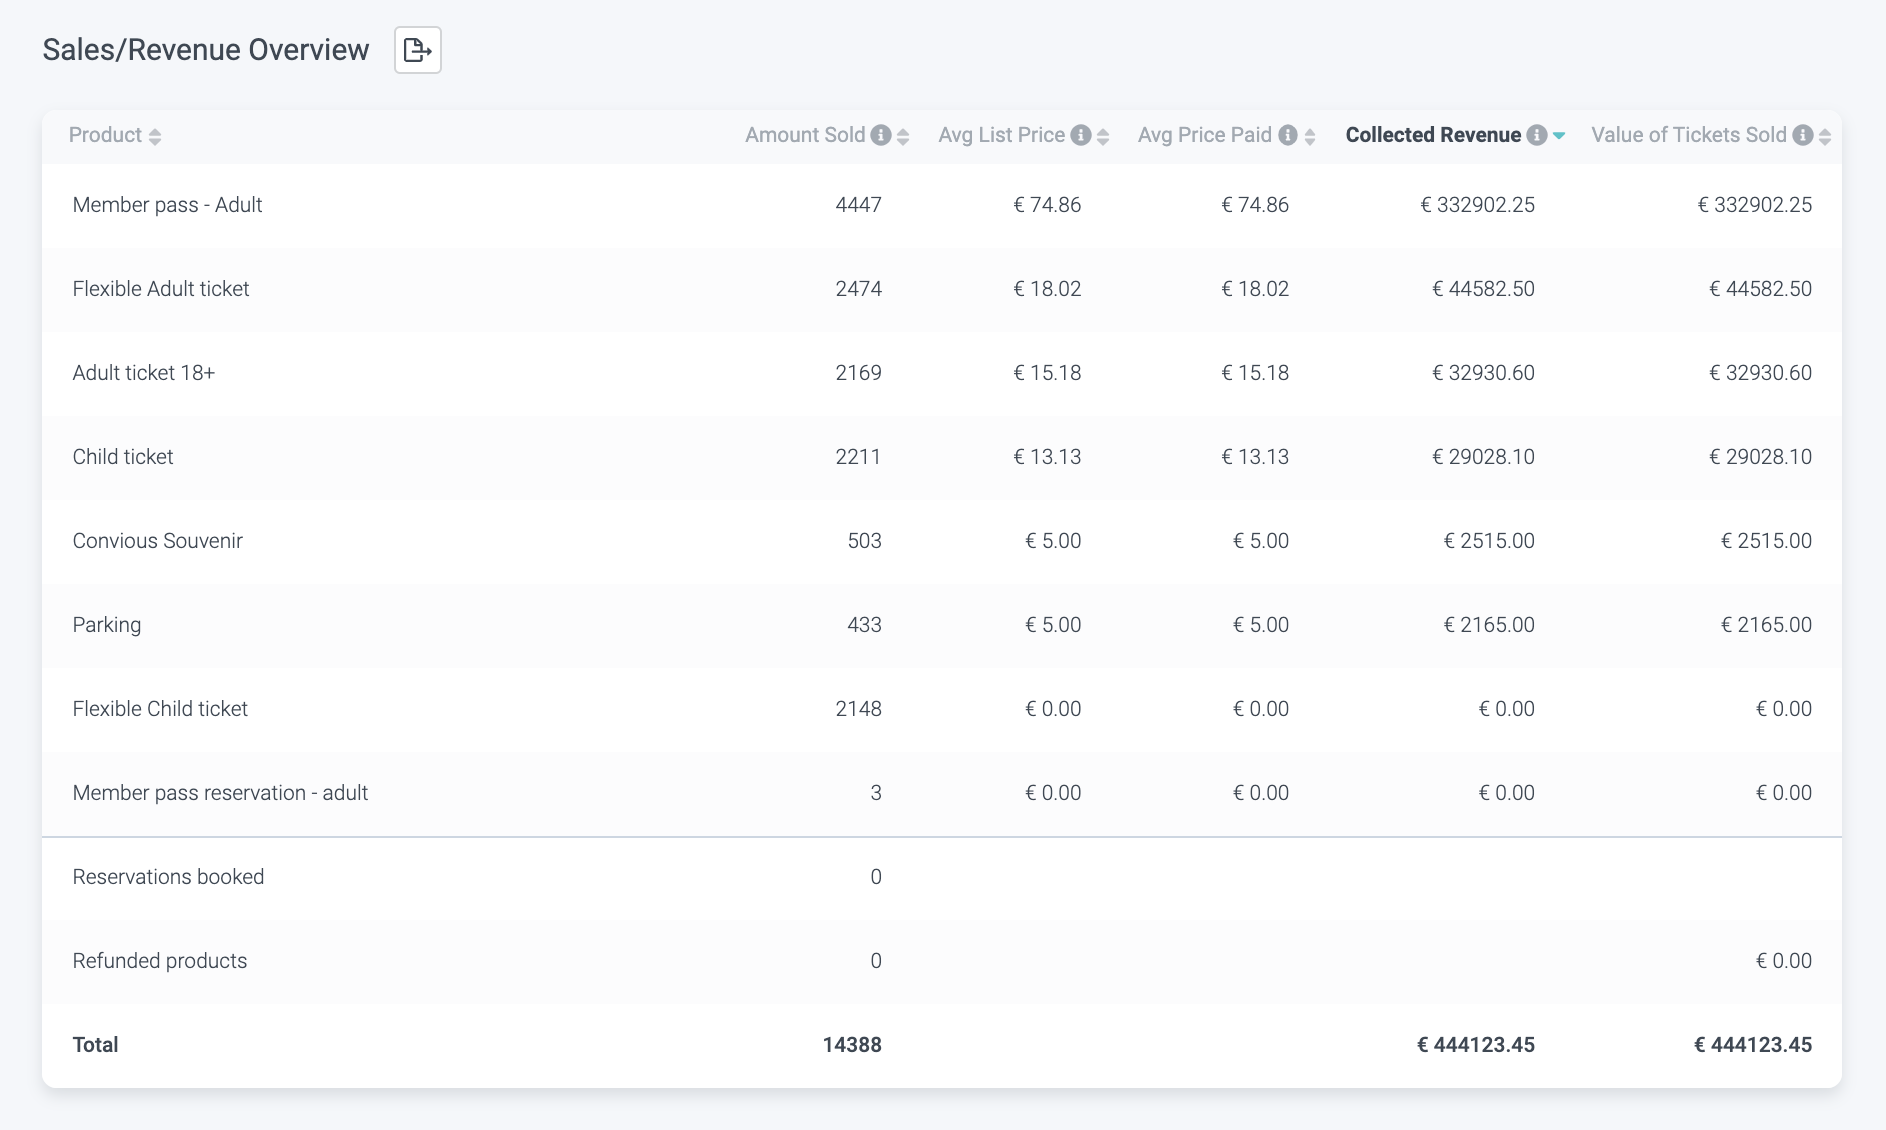
At the bottom, you can see your Sales/Revenue breakdown
This shows you:
- Amounts sold: The number of products sold.
- Average list price: The price of the product without discounts.
- Average price sold: The average price at which the product was sold, deducting the discount.
- Collected revenue: This is the revenue you generated via the tickets you sold through your Convious Checkout. The calculation is Amount sold * Average price paid.
Be aware that minor discrepancies may occur due to the rounding of prices. For example, if enabled, a rounding step size of 0.05 cents rounds prices 11.82 to 11.85 or 11.97 to 12.00.
Not to forget: Next to the header of this chart, you can see the export button. This file as well you can export as .csv or .xlsx file.
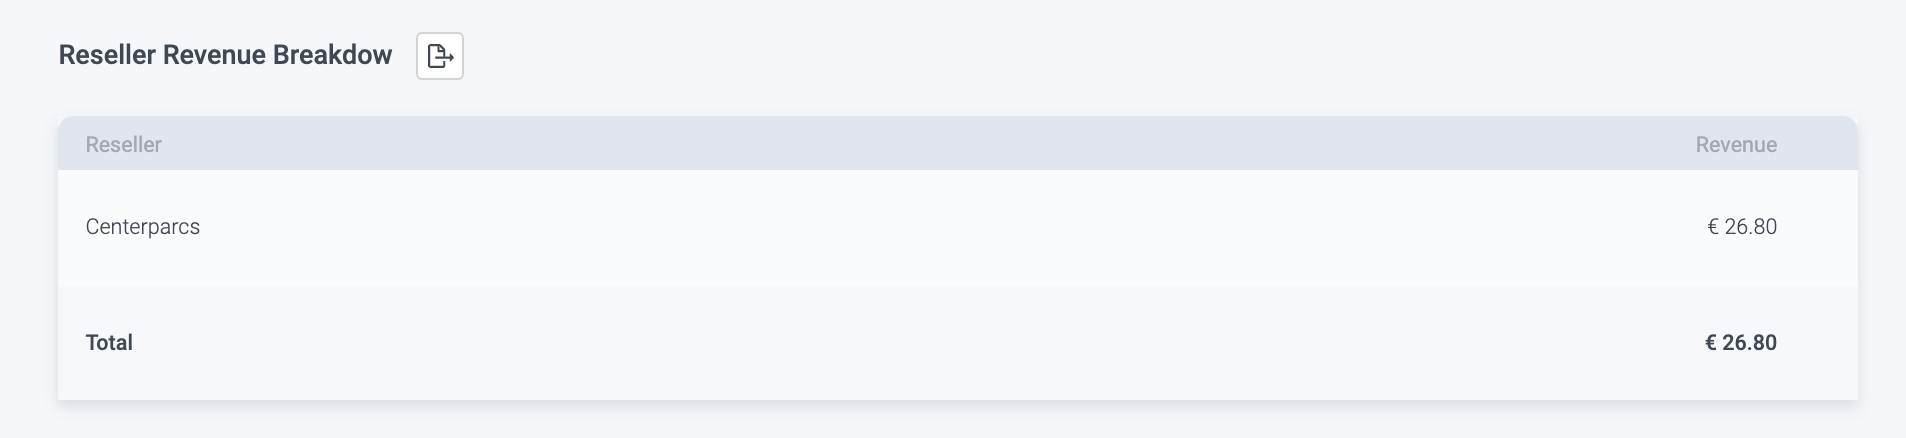
If you have the reseller module enabled, you will be able to view a separate overview like the one above for your resellers.
These breakdowns you can too export as a .CSV or Excel file.
Keep in mind: Sales and Customers reports cannot be compared.
The Sales Report shows you the number of purchases made on a specific day (or within a specific period of time). The Customers Report indicates the number of visitors for a specific day (or within a specific period of time) = it reflects the visit date.
So if a customer bought a ticket in March to come to visit you in April, his/her ticket will show up in the Sales report of March but not in the Customer Report of March. Instead, it will show in the Customer Report of April, since this is the visit date.
And as explained above, the Sales Report may not align with your Customers Report because it shows all sales, including cancelled visits and refunds. The total numbers of cancelled visits and refunds are shown in the overview table at the end of the page. However, neither will be reflected in the Customers Report as it shows the number of arrivals at your venue.
Additionally, bundle items such as family tickets will appear as 1 item in your sales report but reduce capacity by 4 (if the ticket is for 4 people) and thus, display 4 visitors in your Customer Report on the visit date.
Being aware of your sales numbers and how exactly your articles contribute to your revenue will help you optimizing your operations and understanding your customers' behaviours better with every purchase made.
These reports are designed to make this assessment easier for you and give you the right tools to understand and make the most out of the data you capture.
So please, go ahead and try around with the variables. Maybe you will confirm some hunches or discover trends you never knew of!
Did you know you can turn on your notifications to get informed on your sales numbers? This way, you never miss out on your most current insights. Here you can learn how to do that.