The Traffic Report shows you information about your website visitors. Knowing how they behave online should help you in optimizing your strategy and selling more direct.
The insights you get from the Traffic Report:
Understand your traffic (online visitors) to optimize your conversion rates
See if you are attracting more new users or more returning users
Understand the number of users for each device type and optimize your website for these users
See which of your channels is the most or least successful in driving conversions
How to use the Traffic Report:
1. From the category Insights, select Traffic on your left-hand menu
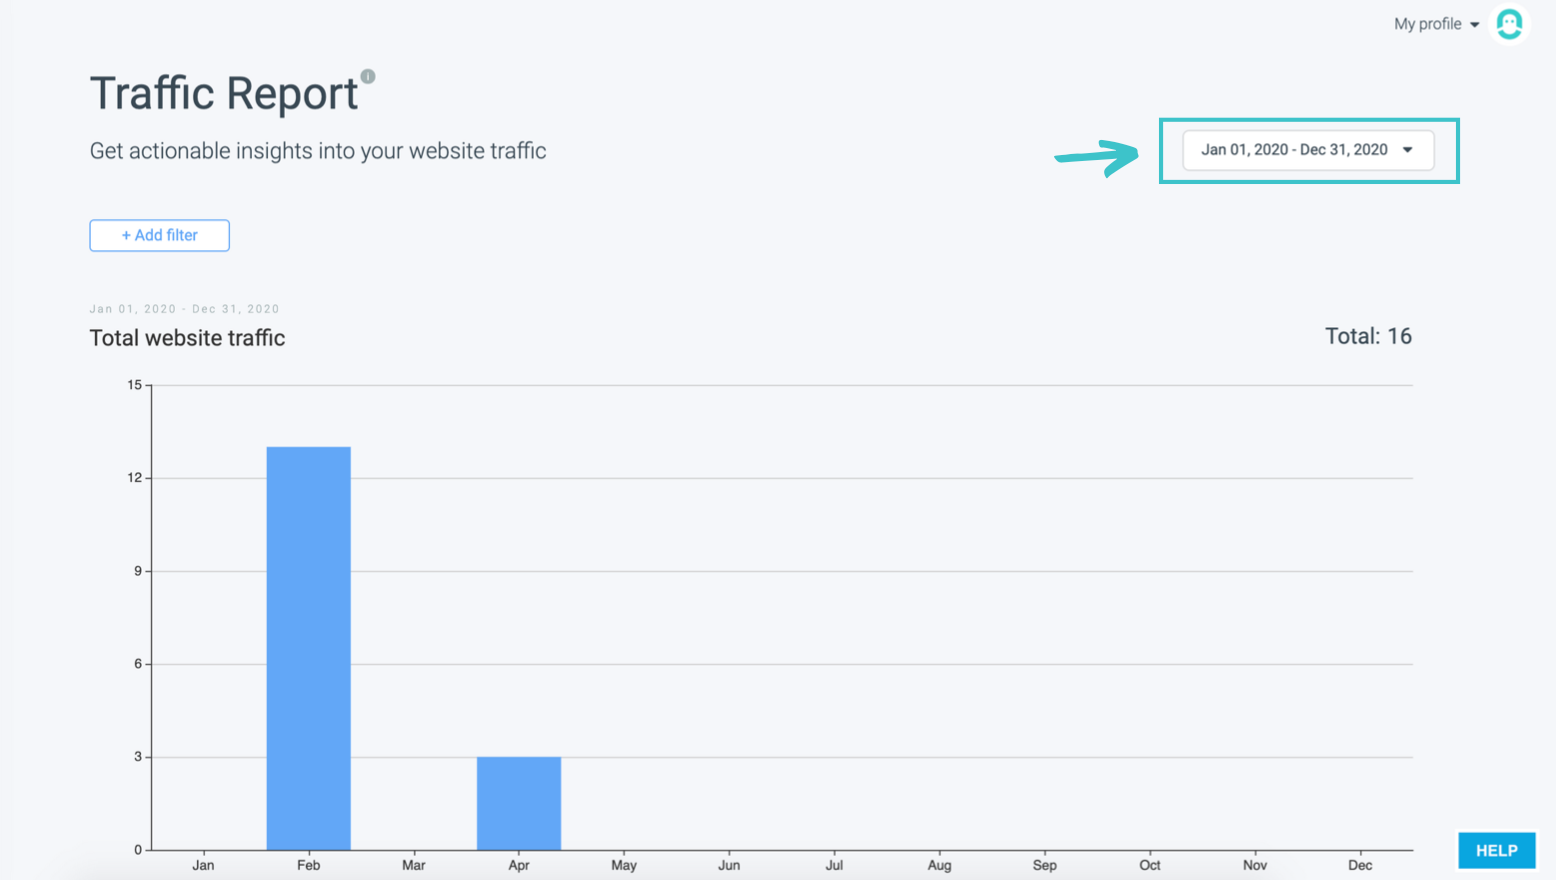
2. Define the date range that you would like to see in your reports
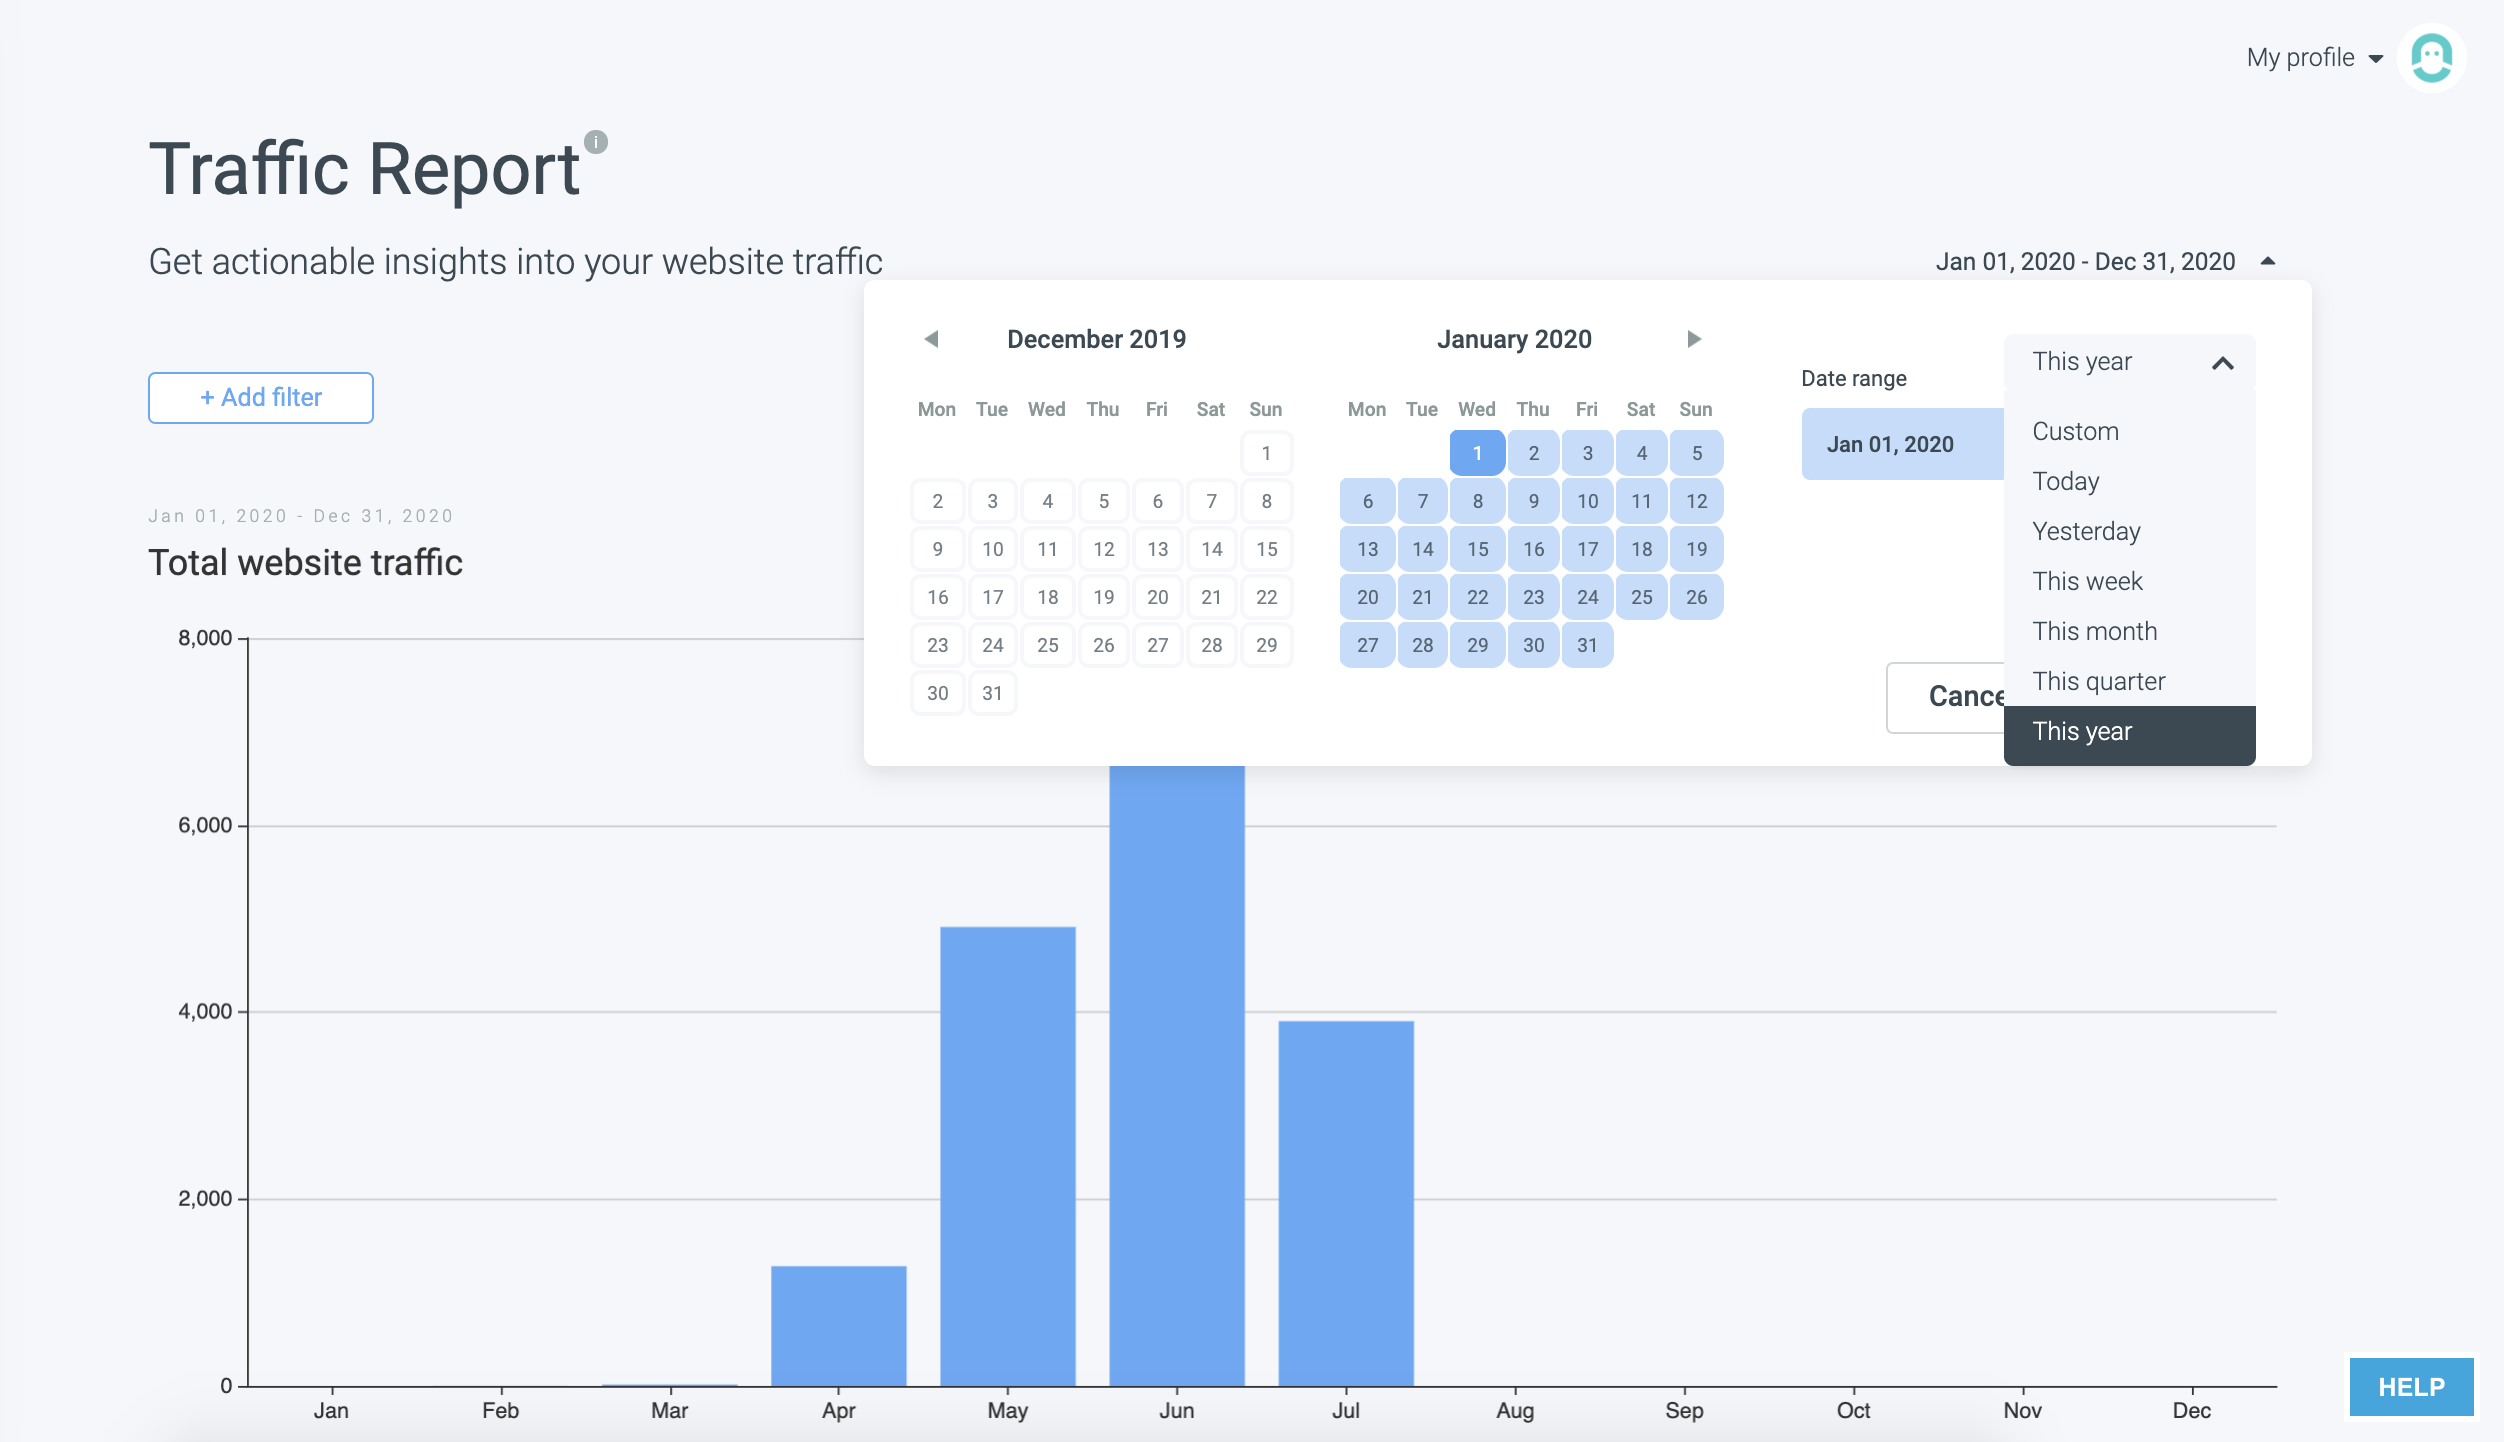
3. Or, if you prefer, select from predefined ranges
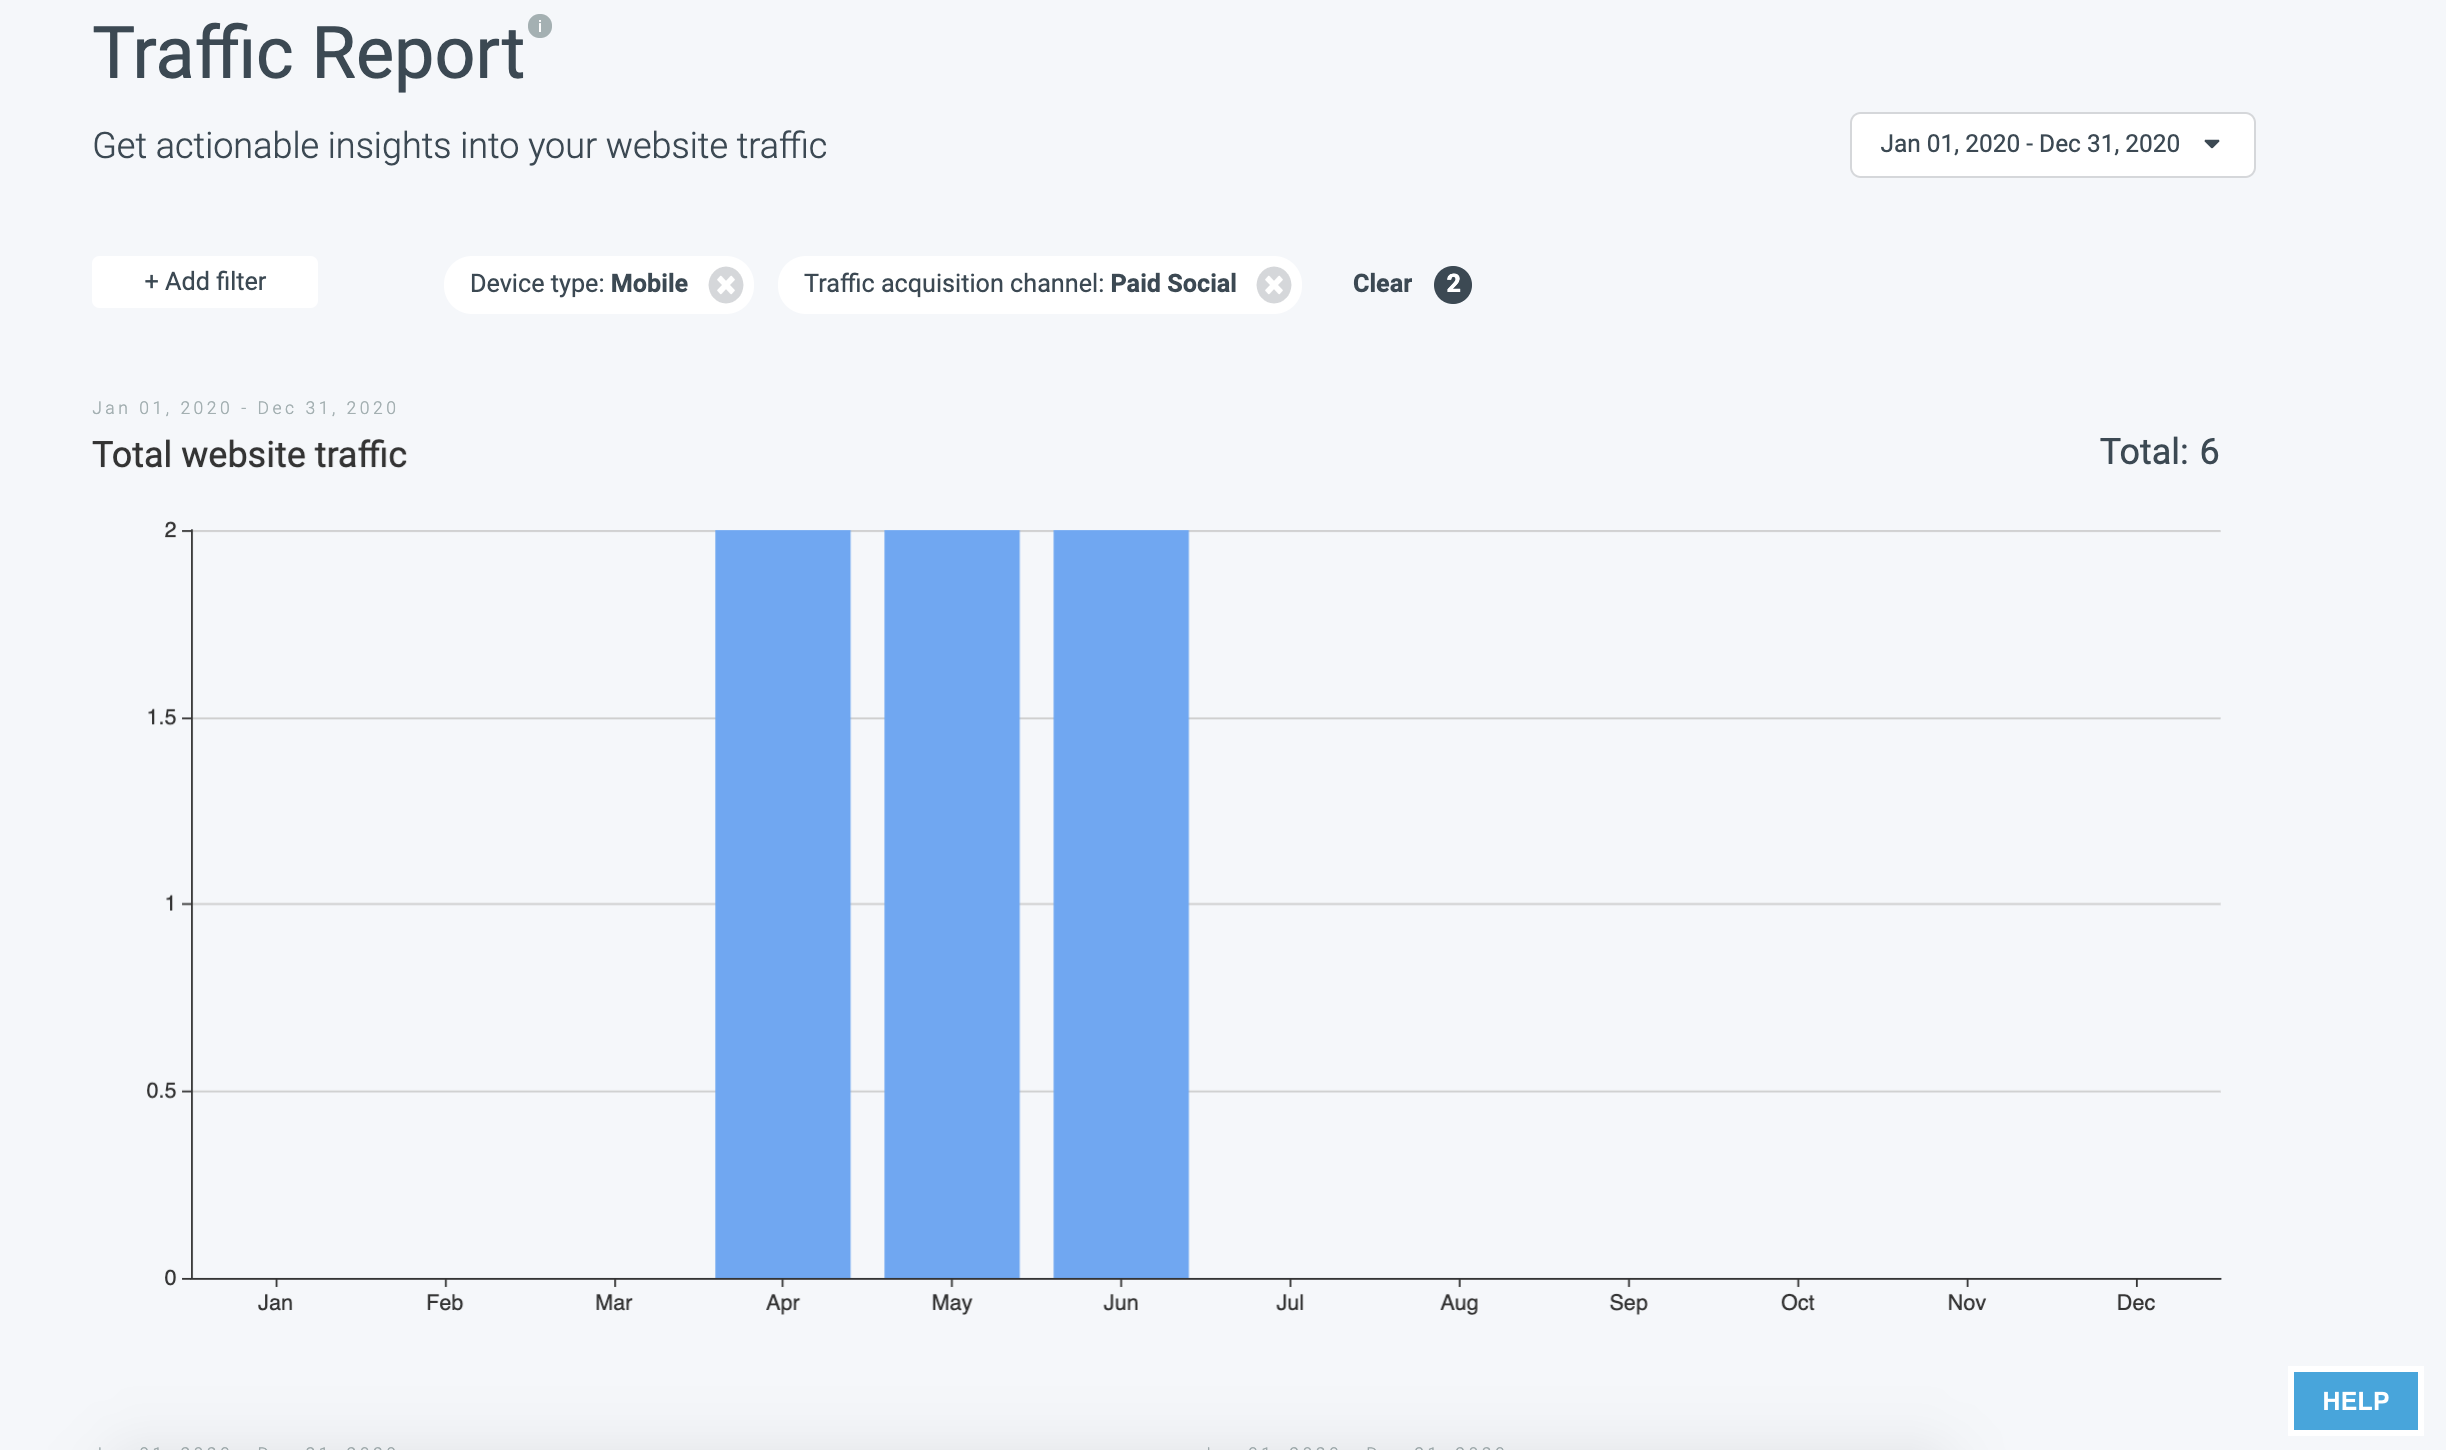
Total Website Traffic
The total number of sessions on your website. Hover over the columns to see the actual numbers. In this case, these numbers are shown per month as we selected Jan 01, 2020 - Dec 31, 2020 (This year).
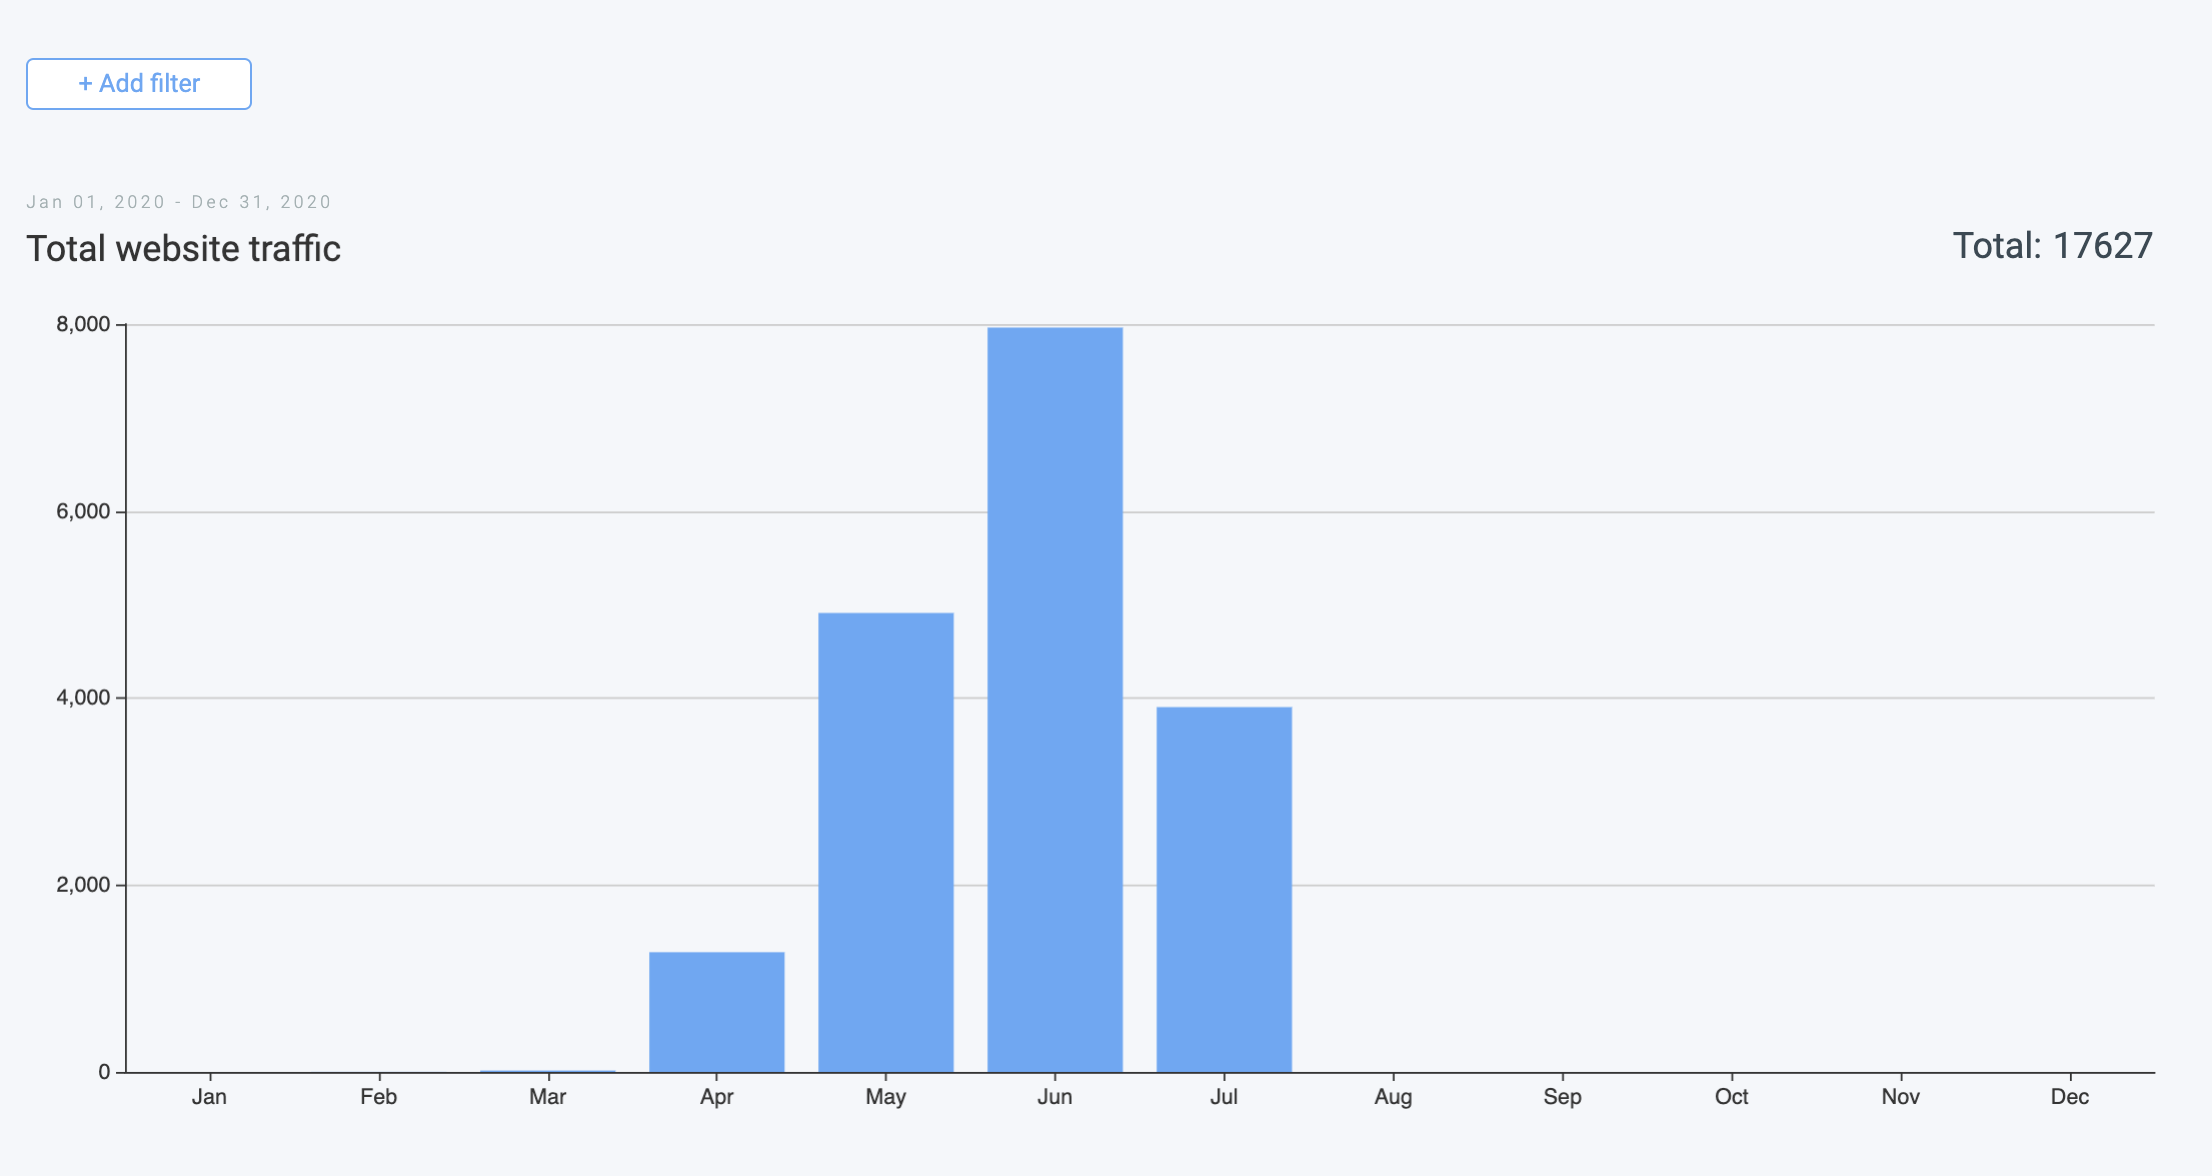
As you can see above the chart, you can filter your total numbers by a combination of variables.
You can choose variables from Traffic by acquisition channel including Direct, Email, Organic Search, Others, Paid Display, Paid Search, Paid Social, and Social, as also by Device type including Mobile, Desktop and Other.
Different from the reports we dive into below, here you can choose and combine the variables that are of interest to you.
Do you wanna know how many visitors came from paid social with a mobile device? Easy!
But please, try it for yourself with some combinations to test your hunches or discover entirely new insights!
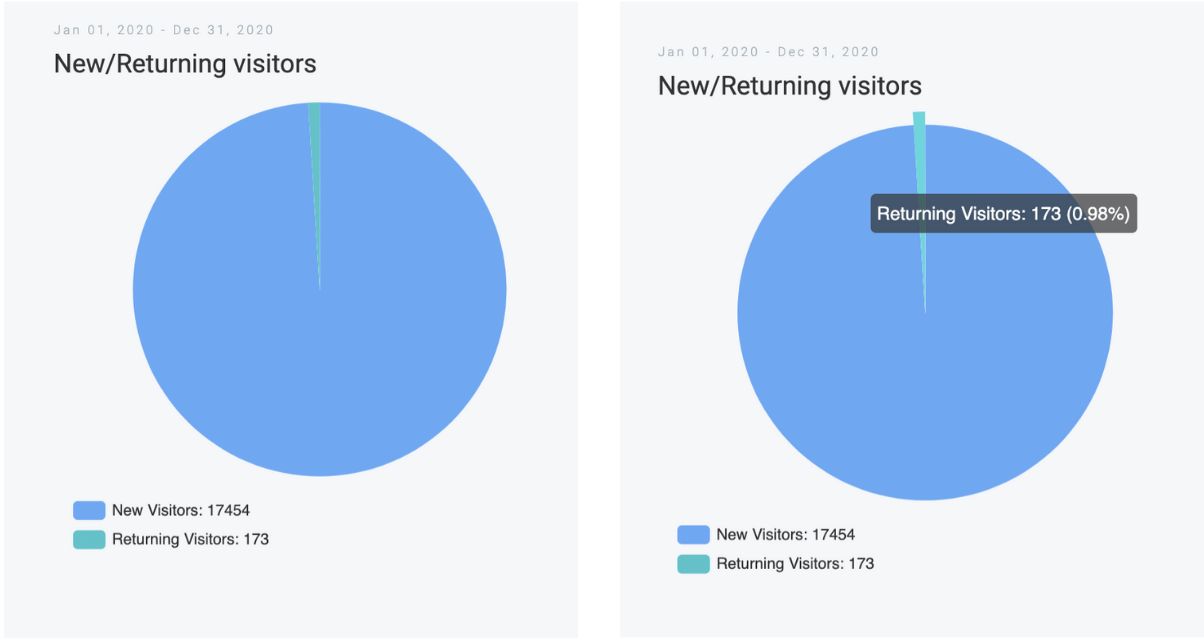
New/Returning visitors
A pie chart that shows you how many users entered your website for the first time and how many have returned (for the second time or more). Hover over the slices to see the actual numbers.
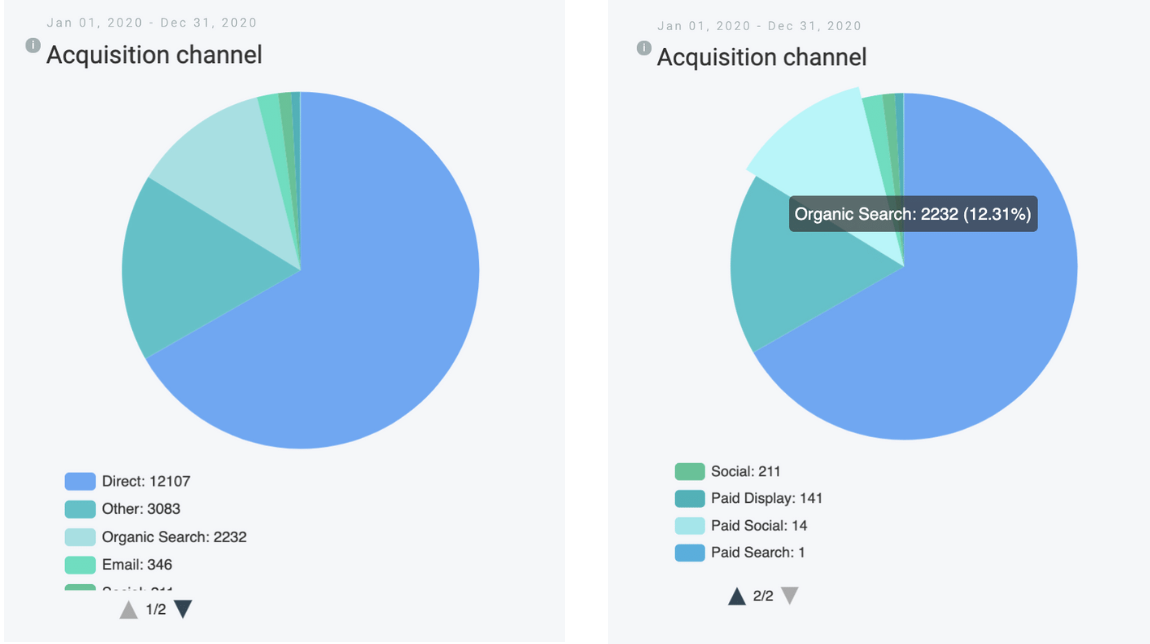
Acquisition Channel
A pie chart that shows you the distribution of your traffic by acquisition channels. Again, hover over the slices to see the actual numbers.
Acquisition channels displayed in the report:
Organic Search: users that searched and found your page in a search engine
Paid Display: users that clicked a paid ad
Paid Search: users that clicked a paid ad in a search engine
Paid Social: users that clicked a paid ad in a social media
Direct: users that typed your address in the address bar
Other: all other possible channels aggregated
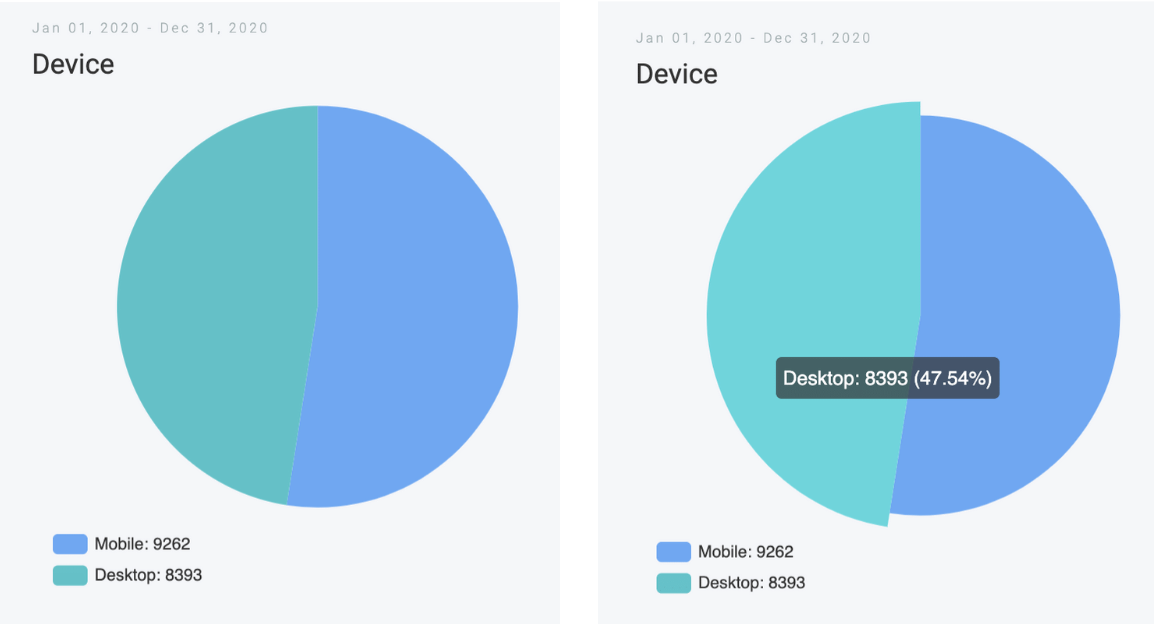
Device
A pie chart that shows you the distribution of your traffic per device type: desktop, mobile or tablet.
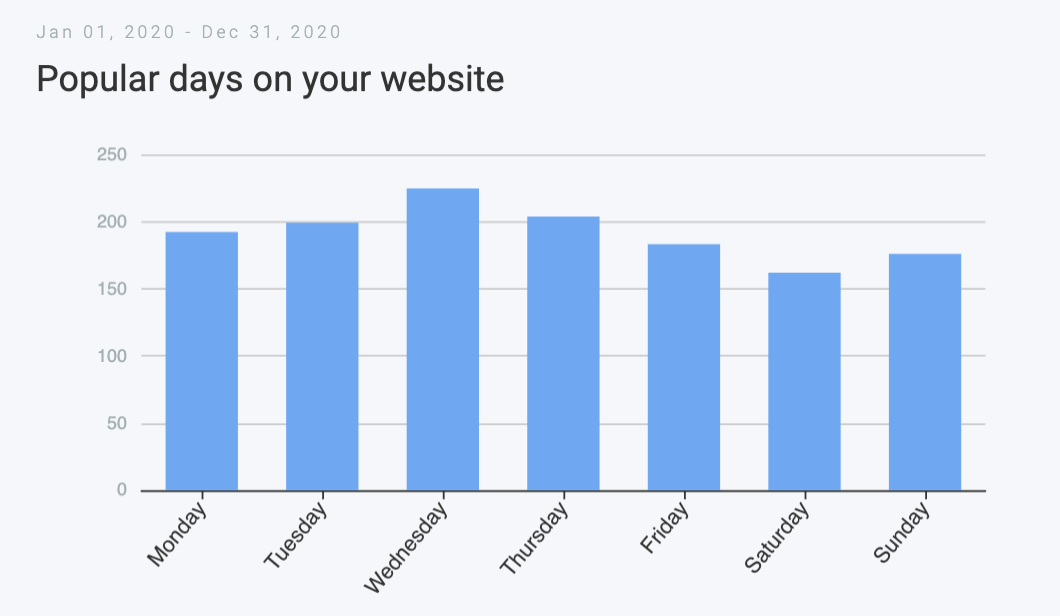
Popular Days on your website
A quick overview of which days of the week you have more traffic on your website. Note that this data is aggregated and reflects the date range that you’ve selected.
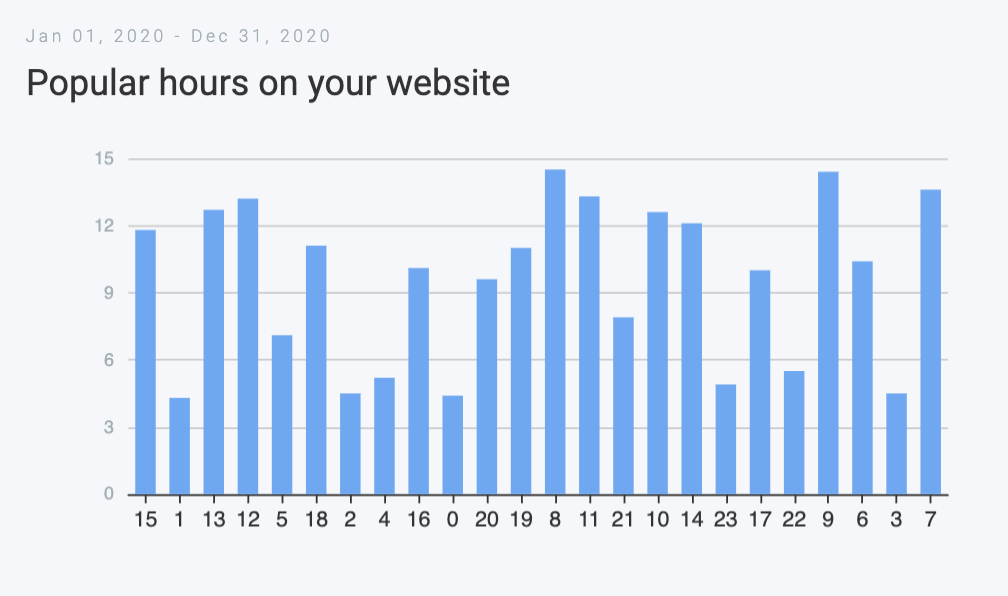
Popular Hours on your website
A quick overview of which hours of the day you have more traffic on your website. Note that this data is aggregated and reflects the date range that you’ve selected.
Are you interested in seizing more opportunities by always having all your insights in one place?
Check out our Related Articles.