The usage of discounts, either via Coupons or Vouchers, is an important part of your customer acquisition and retention and thus be accurately monitored and understood.
Always keep a clear overview of:
Redeemed codes
Collected revenue vs. the original value of the tickets sold
The average order value with codes and without codes
and much more.
Answer questions such as:
Are all codes of this campaign used?
Which campaign is the most successful?
Are we increasing or decreasing order value, cart size or revenue using discount codes?
and many more.
Let's dive into your discount code report
1. Navigate to your main menu on the left-hand side, expand the Reports section and choose Discount codes.
2. First, as with every report, you can choose a time frame you want to review.
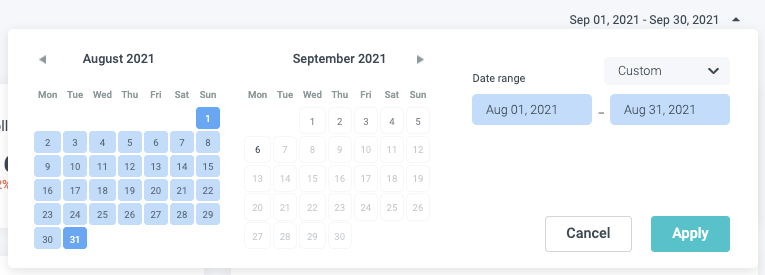
For this example, we will choose the Custom Range of the month of August 2021. Next to the Custom Range you can also select various predefined ranges.
3. The first information you see will be the following:
The amount of discount codes used during the selected time frame, plus the comparison to the previous period (In this case, the month of July).
The collected revenue received from those orders that were placed using a discount/voucher code.
The original value of tickets sold: The original value of a ticket is the List Price before the discount. Thus, the total original value of tickets sold is the aggregated value that all tickets sold with a discount originally had before the discount was applied.
The average discounts given by the codes indicate the average percentage given as a discount on the original list prices.
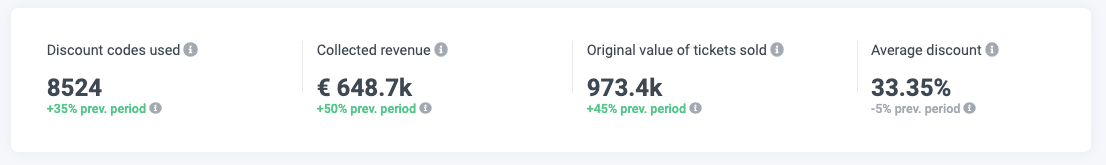
Here we see that there were 8524 codes used in August. This is +35% more than compared to July. And although 35% more codes were used, the revenue collected rose 50% in August, compared to July leaving the collected revenue at 648.7k.
The original value of all tickets sold, the value the tickets had before the discount was applied, is 973.4k, which is an increase of 45%.
In August, the average discount thus, declined by 5% compared to July and was at an average of 33.35%.
4. Further, you can see an aggregation of the most popular discounts. Hover over the bars of the chart to see the exact amount each popular discount was used.
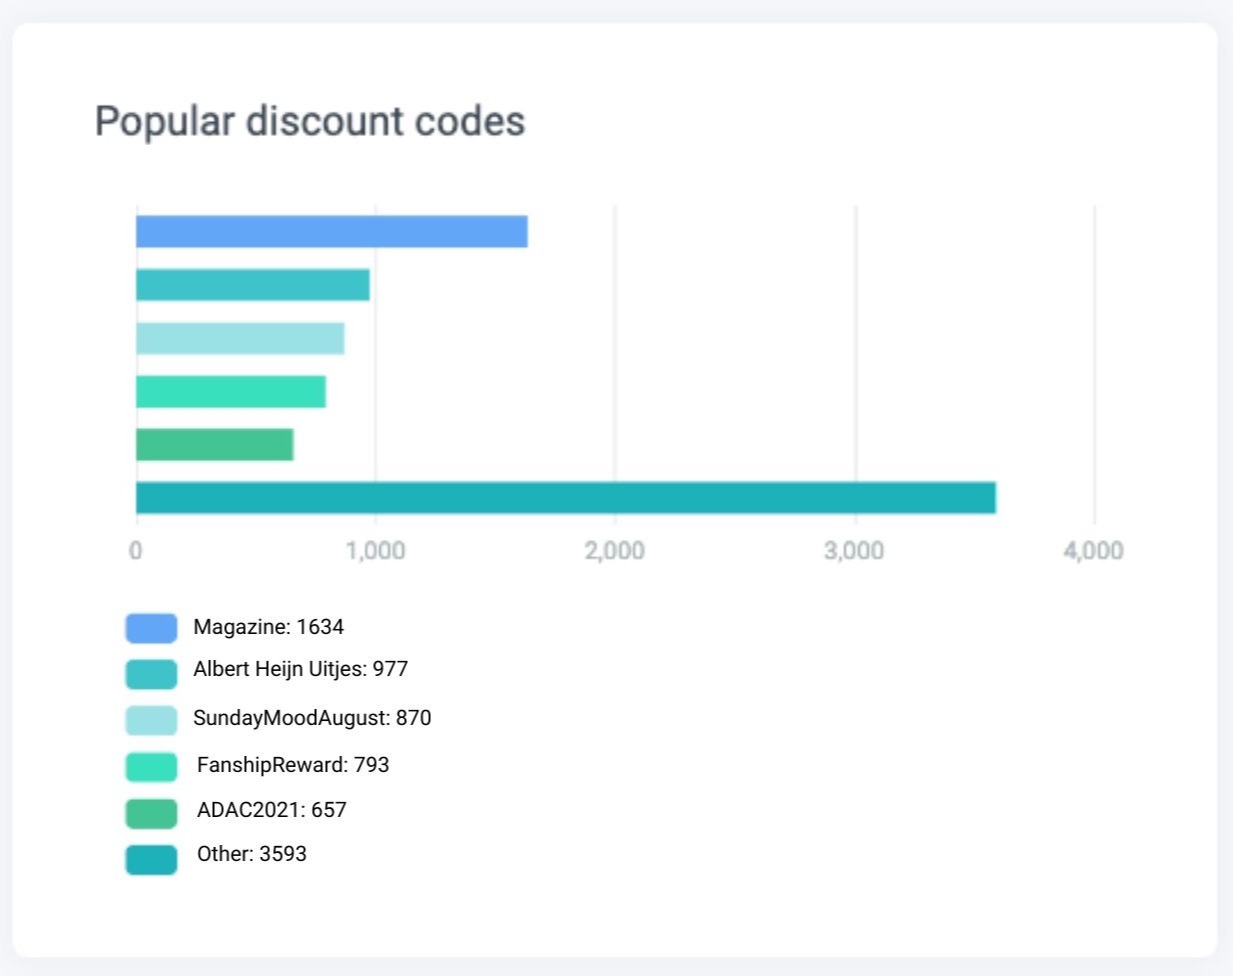
Please note: Here you will see the actual codes, not code names.
5. Next, you can see the average order value and cart size of the orders placed in August with and without codes in direct comparison.
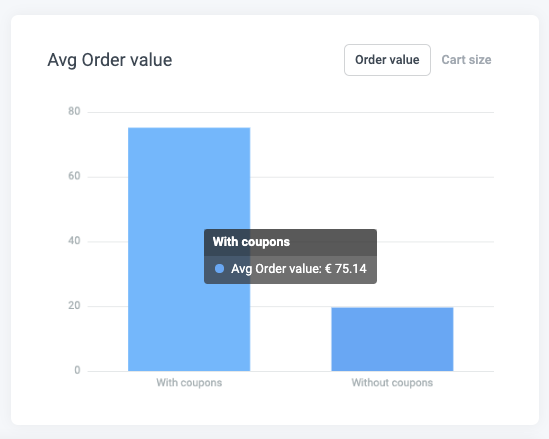
This is a great measure of the impact of your codes because as you can see although you might have been given an average discount of 33.35% on your orders, the order value of those orders placed with a code is much higher than compared to those without a code.
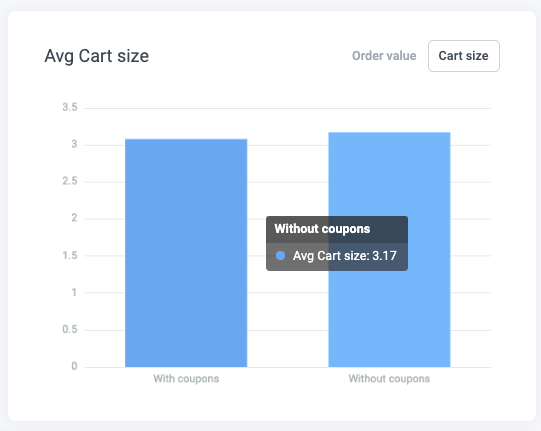
And all that despite the fact that the average cart size without a code is slightly higher than with a code.
This lets us conclude that customers do not necessarily buy more items when they use codes, but codes tend to invite them to buy the pricier products and, thus, to spend more instead.
Can you see? Investigating the code usage gives you great intelligence into your visitors' buying behaviour!
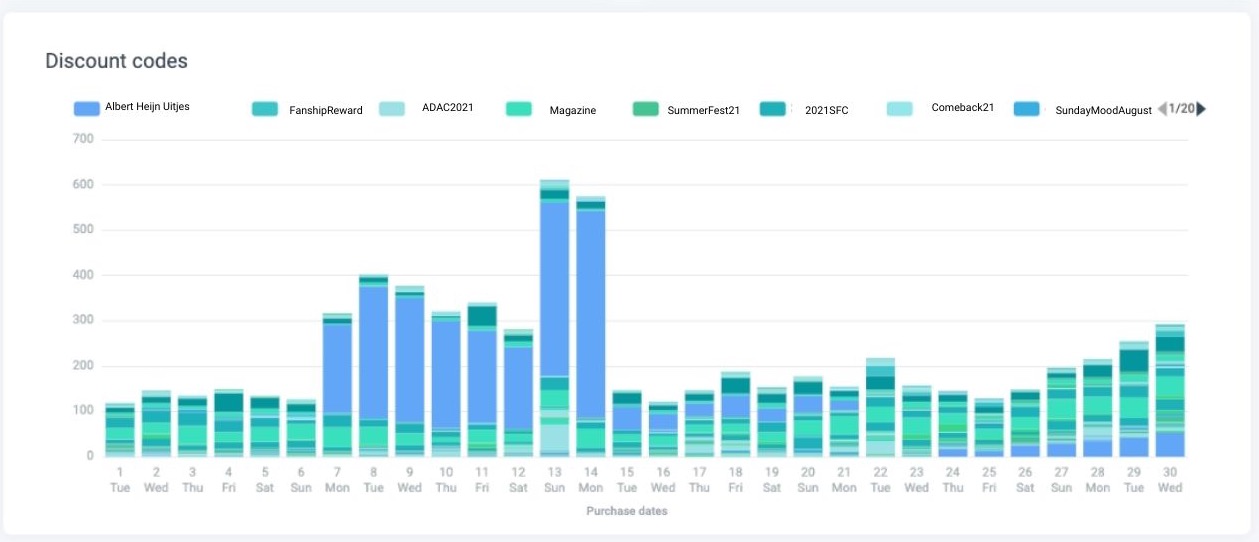
6. Lastly, you can see a more detailed view of the code usage spread over the month. Hover over the bars of the chart to see the exact amount each discount code was used in a purchase per day. Here as well, you will see the actual codes, not code names.
And this is it - this is how you can use your discount code report to understand your code dissemination and usage and how that, in turn, provides you with great insight for informed decision making!