Key Performance Indicators (KPIs)
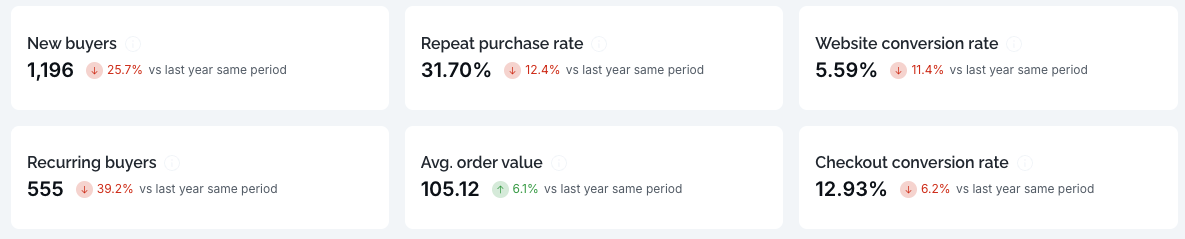
The top section of the report highlights critical metrics that measure the health of your marketing funnel. Each KPI shows a comparison against the same period from the previous year to help you track growth.
New Buyers: The number of unique customers making their very first purchase (based on email address in After Payment Form ).
Recurring Buyers: Unique customers who have previously purchased from your venue (based on email address in After Payment Form ).
Repeat Purchase Rate: The percentage of your customer base that has made more than one transaction (based on email address in After Payment Form ).
Average Order Value (AOV): The average revenue generated per completed order.
Website Conversion Rate: The percentage of total website sessions that result in a purchase.
Checkout Conversion Rate: The percentage of visitors who enter the checkout and successfully complete their order.
Geographic & Demographic Insights
Understanding who your visitors are and where they live is essential for high-return ad targeting.
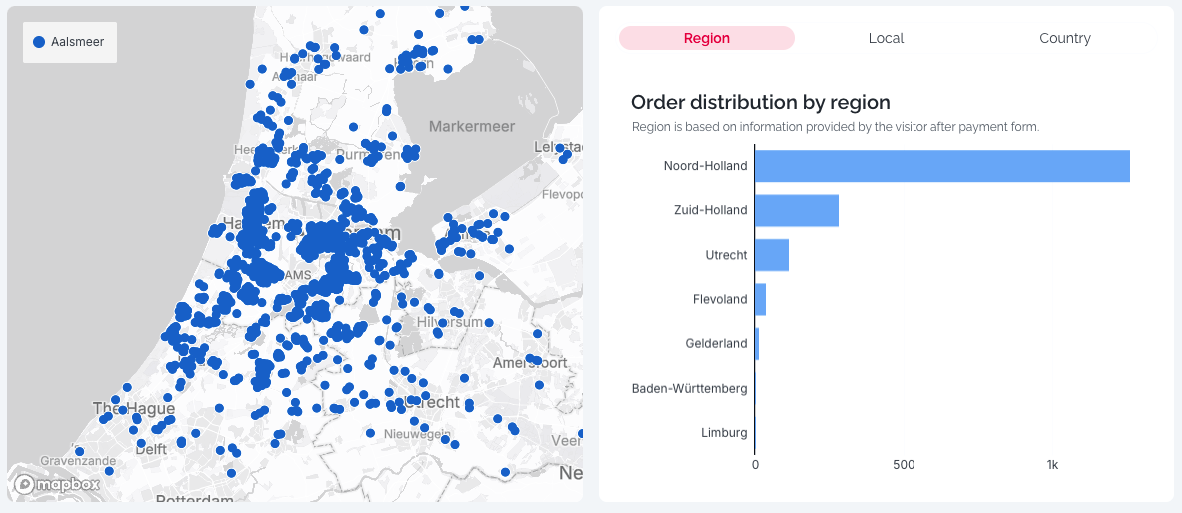
Order Distribution (Map): A visual heatmap showing where your buyers are located based on the postcodes they provided on the After Payment Form. Use this to identify specific regions or provinces for geographically targeted ad buys.
Order Distribution by Region: A ranked bar chart showing your top-performing countries or regions.
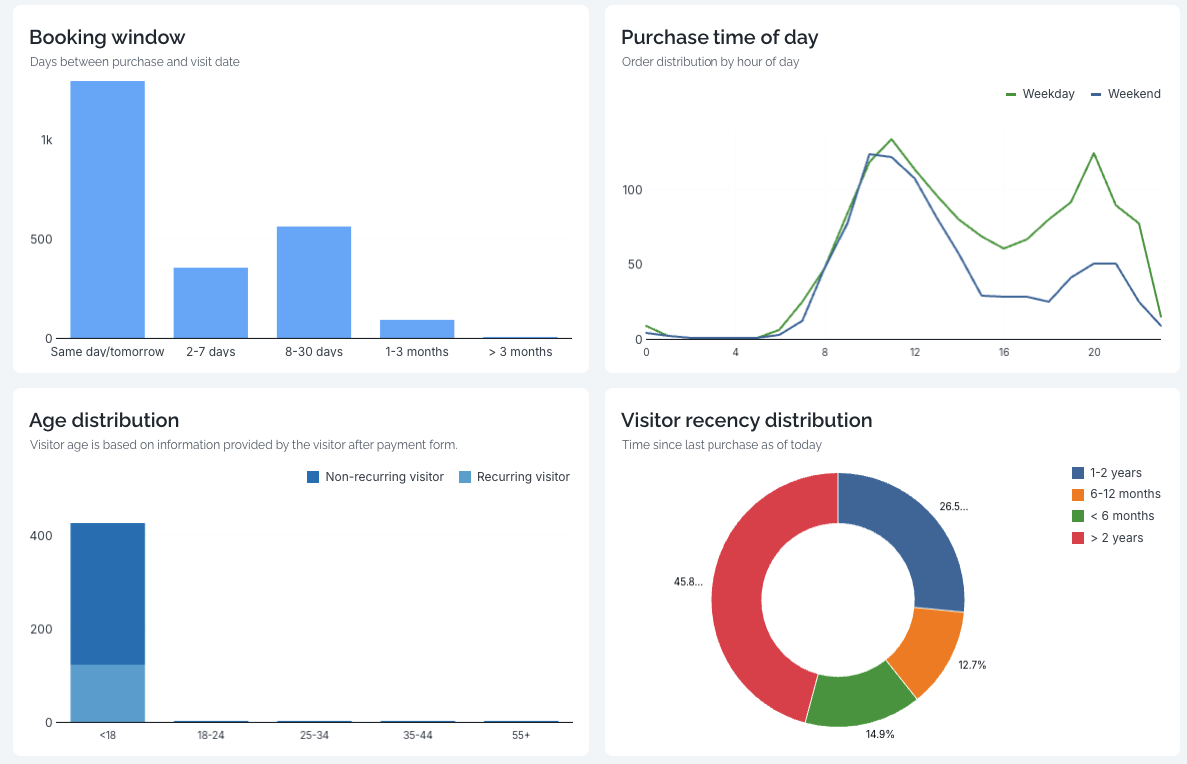
Age Distribution: Breaks down your audience into age groups (e.g., 25-34, 35-44). This chart distinguishes between New and Recurring buyers, allowing you to tailor your messaging (e.g., family-focused vs. thrill-seeker) to the right demographic.
Behavioral & Planning Trends
These insights help you align your marketing schedule with actual visitor behavior.
Booking Window: Visualizes how many days in advance visitors buy their tickets. If most bookings are "Same day/tomorrow," prioritize high-urgency social media ads.
Purchase Time of Day: Tracks order volume by hour for Weekdays and Weekends. Use this to "front-load" your digital ad spend during peak buying hours, such as evening windows.
Visitor Recency Distribution: Shows how long it has been since a customer's last purchase (e.g., <6 months, 6-12 months). This is a powerful tool for triggering re-engagement or "We miss you" email campaigns.
Channel & Product Performance
Identify which marketing channels and products are driving your revenue.
Sales per Acquisition Channel: A pie chart showing which sources—such as Paid Social, Email, or Organic Search—are driving your revenue.
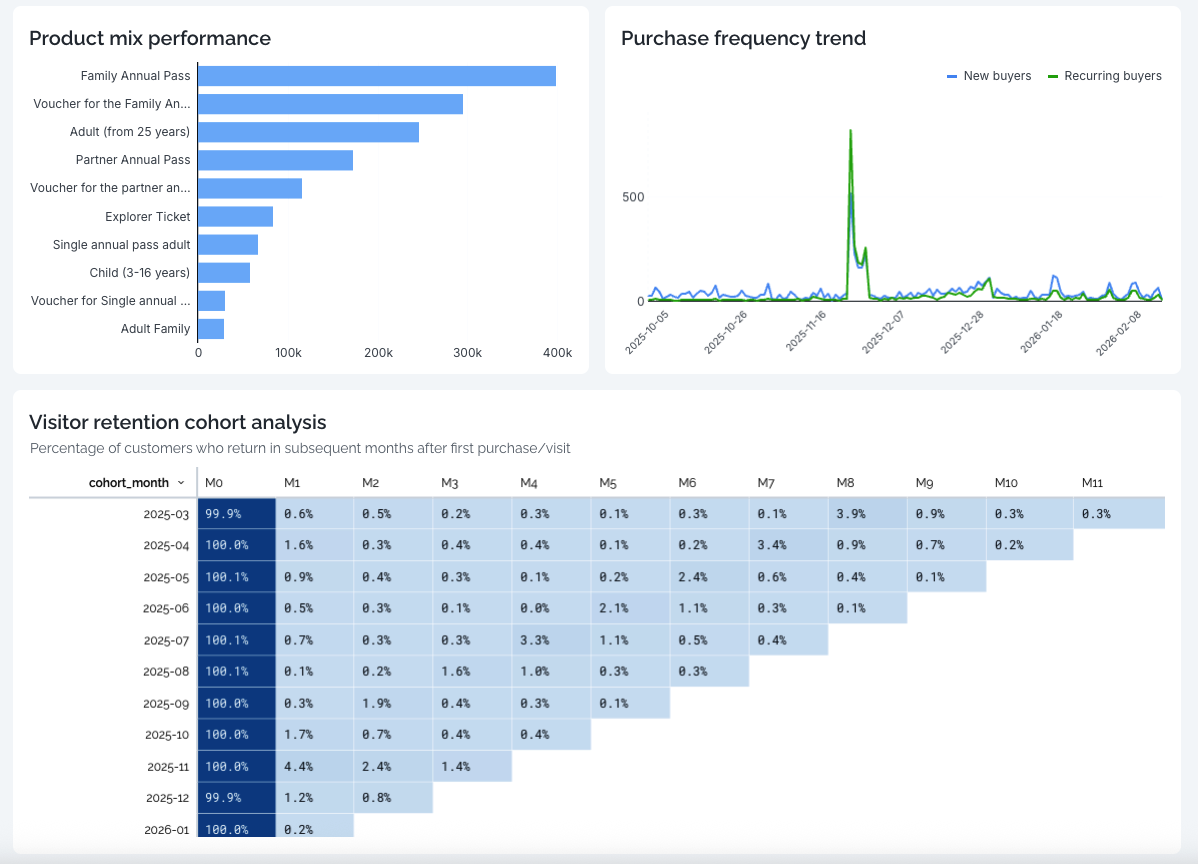
Product Mix Performance: A ranked list of your top-selling products. Use this to see if specific tickets, like Family Annual Passes, are outperforming others.
Device Breakdown: Compares traffic sessions vs. completed checkouts for Mobile, Desktop, and Tablet. If mobile traffic is high but conversion is low, it may indicate a need to optimize your mobile user experience.
Long-Term Loyalty
Track how well you are retaining visitors over time.
Visitor Retention Cohort Analysis: This table tracks groups of customers based on the month they made their first purchase (the "Cohort"). It shows the percentage of those same customers who return in subsequent months (M1, M2, etc.).
Goal: Identify which months' marketing campaigns resulted in the most loyal, long-term visitors.
Purchase Frequency Trend: A line graph comparing the daily volume of New vs. Recurring buyers to help you spot seasonal spikes in loyalty.