1. Understand what you're looking at with built-in definitions
Need clarity on what a metric means? There are two easy ways to find definitions:
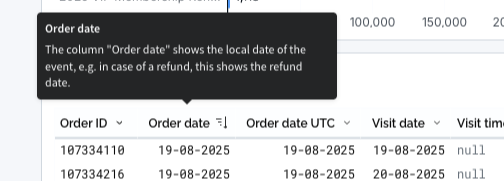
Look for the ℹ️ icon next to a chart or title: hover to view the explanation
In tables, hover over the column title to see the full description
These definitions help you make confident, data-informed decisions without second-guessing the numbers.
2. Save time with bookmarks
Use the same filters every day? Don’t set them manually each time.
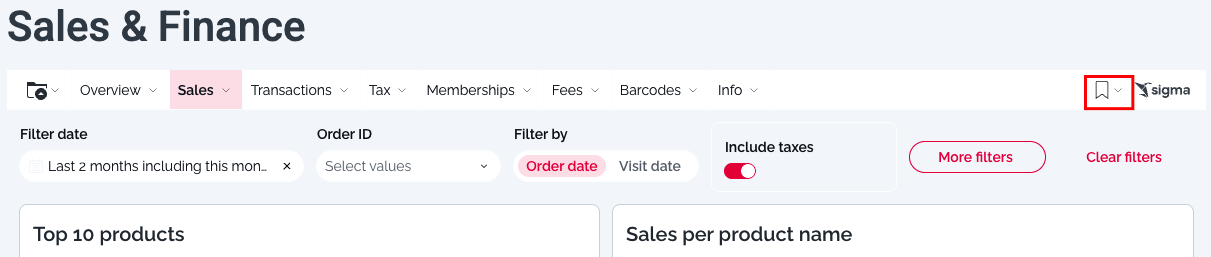
In the top-right corner, click “Save bookmark” after applying your filters
The next time you open the dashboard, just select your bookmark to instantly return to your preferred view
Bookmarks are user-specific, so they won’t affect what others see
This is especially useful for daily check-ins or recurring tasks.
3. Automate reporting with scheduled exports
Say goodbye to manual downloads. With Scheduled Exports, you can:
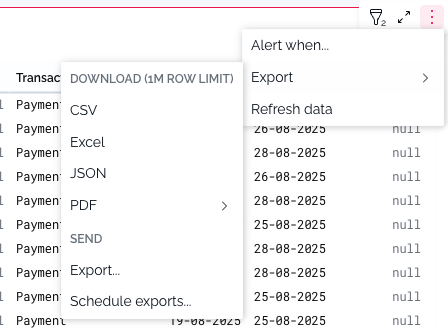
✅ Export the entire dashboard or just individual charts or tables
✅ Choose how often you want reports: daily, weekly, monthly, or custom
✅ Send exports directly to email, Google Drive, or SFTP servers
To get started, click ‘Schedule exports’ on any dashboard or chart.
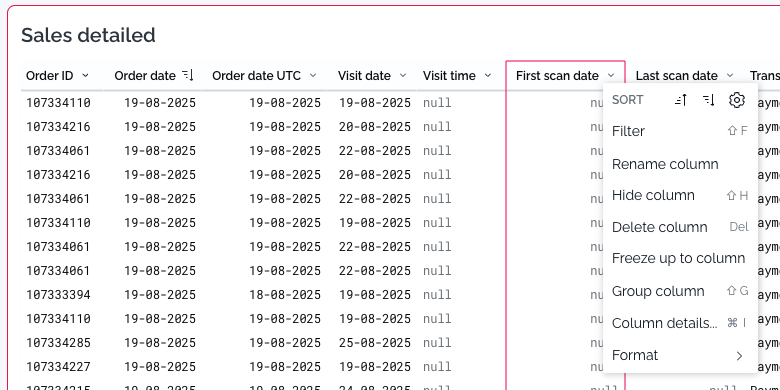
4. Customize tables to suit your needs
You can personalize tables directly within the dashboard:
Click on any column to filter, rename, or remove it
Rearrange the view to highlight the data that matters most to you
Combine this with bookmarks to save your custom view for later
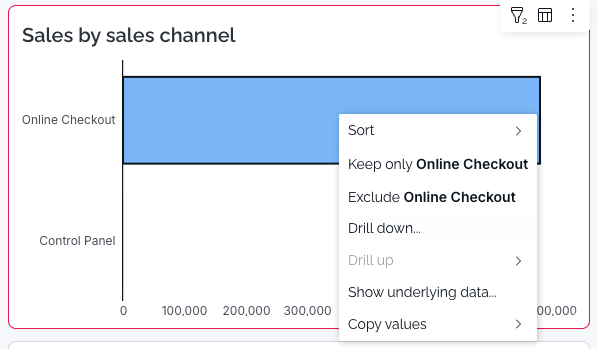
5. Use drilldown for deeper insights
Want to dive into the details behind a chart?
Right-click on a chart (e.g. Sales Channel)
Select Drilldown to explore the breakdown of that metric
This gives you quick answers without needing to switch tabs or download anything.
6. Reset the dashboard anytime
Applied too many filters and lost track?
Click “Reset dashboard” at the top of the page to clear all filters and start fresh.
This is a quick fix when your data view looks off or unexpectedly empty.