Who is this for?
The Overview tab is designed for teams responsible for managing the venue during the operating day:
Operations Managers
Guest Services / Front-of-House teams
Security & Safety Officers
These teams rely on accurate visitor information to plan staff levels, manage crowd flow, and prepare the park for peak moments.
Main KPIs

1. Expected Visitors
Shows how many visitors are expected today based on:
Dated tickets
Paid reservations
Not included yet:
Pending reservations (future improvement)
2. Visitors in Park
Shows how many visitors have already entered the venue based on redeemed tickets (scans).
Calculation details
One barcode equals one visitor.
Upsells do not count as visitors and are not included in this number.
Capacity pools (capacity_reduction logic) are not yet included in the calculation (future improvement).
These visitors are not included in the Expected Visitors calculation, but still contribute to the Visitors in Park number.
This KPI helps you track how busy the venue is at any moment.
3. No-Shows
Shows how many expected visitors did not (yet) arrive.
Helps understand the difference between planned and actual attendance.
4. Unplanned Visitors
Shows the number of visitors entering with:
Undated tickets
Memberships
These visitors were not included in the “Expected Visitors” number but still increase attendance inside the venue.
Charts and Insights
Expected arrivals per hour
This chart shows how many visitors are expected to arrive in each timeslot, based on planned visit data.
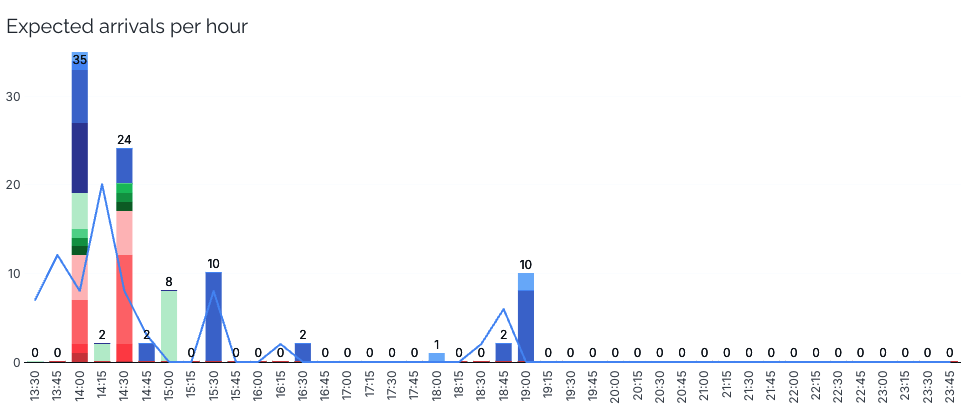
How it works
Visitors arriving from 9:00 to 9:14 are assigned to the 9:00 timeslot.
A visitor arriving at 9:15 is assigned to the 9:15 timeslot.
The chart includes:
A breakdown per product
A line showing actual arrivals based on scan data
Why it’s useful
This chart helps your team prepare for operational peaks:
Staff planning
Queue preparation
Entry area management
The default filter is today, but you can select any day.
Planned visitors per hour (cumulative)
Shows:
Expected visitors (from dated tickets and reservations)
Actual visitors (from scans)
Displayed cumulatively across the day
Consider end times
If you enable Consider end times, the chart adjusts visitor counts based on product end times, reducing the number once a visit is expected to end.
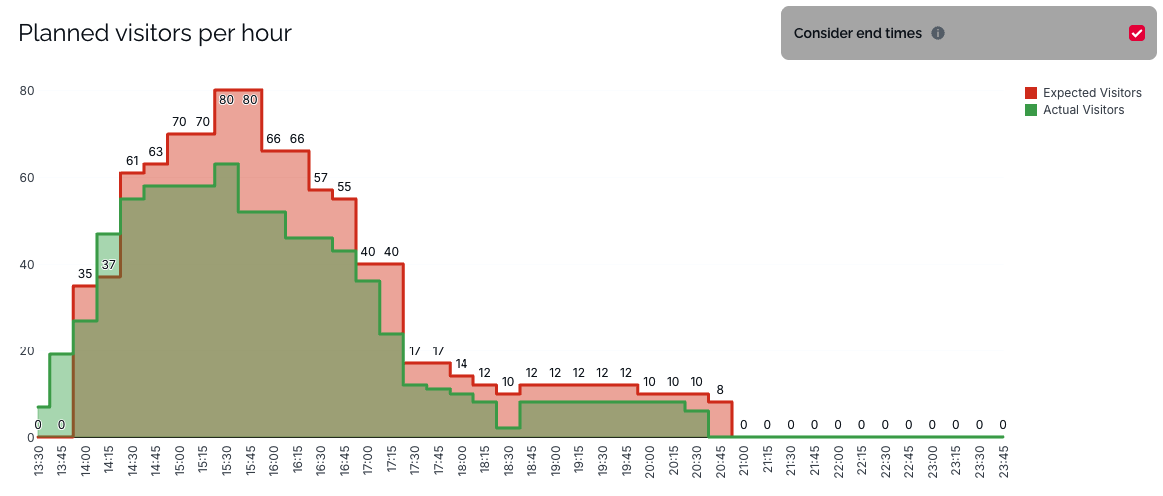
Why it’s useful
Partners can quickly see:
Whether arrivals match expectations
How many visitors should still be in the venue
How the day is progressing to plan staffing or reallocation
Daily visitors (14 days past & future)
Shows expected and actual visitors for:
14 days in the past
14 days in the future
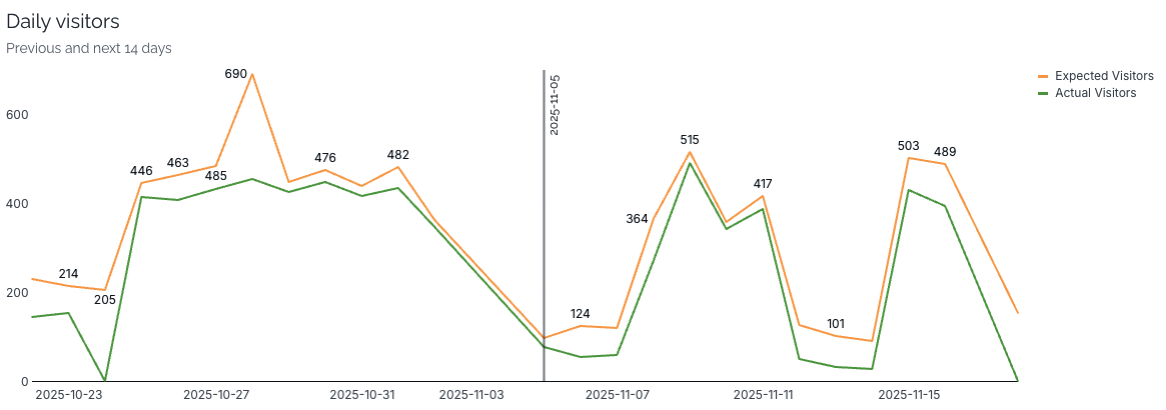
Why it’s useful
Understand past differences between expected vs. actual visitors
Identify trends, weather impact, school holidays, or demand patterns
Prepare for the next days with more confidence
Additional interaction
You can click directly on a day in the chart to filter the dashboard to that specific date, making navigation faster and more intuitive.
Correlation: no-shows & weather
Shows:
Daily no-show percentage
Weather data per day
Hover to see:
Weather condition
Minimum and maximum temperature
Precipitation chance
Why it’s useful
Partners can:
Understand how weather impacts no-shows
Improve future forecasting
Adjust resourcing on days with expected low attendance
Not Included Yet
The following elements will be added in future improvements:
Capacity pools
Pending reservations