Why are reports so important?
Different venues have different indicators of success. For some, it could be the revenue generated; for others, the number of visitors, even website traffic, could be a relevant key indicator for success.
The reporting tools are designed in a way that they will give you essential insights and help in developing marketing plans, guide budget preparation, and enhance decision-making.
Let’s dive into the essentials of each of the reports available on your Convious Control Panel.
Overview Report
In this report, as the name suggests, you will find a general overview of your venue’s activity. In the overview report you will find:
- Visitors forecast: Our AI-powered algorithms do all the calculations and forecasts for you. Based on all your real-time data, you will be able to see up to a week in advance of visitors’ forecasts. You will see:
- Expected visitors for today: This is based on the number of tickets and reservations purchased.
- Expected visitor for tomorrow & next week: based on the number of tickets and reservations sold for that specific range of time + the expected to be sold forecast.
In the graph, you will be able to see the day by day forecast with a one-week in advanced prediction. The blue shades indicate the potential maximum and the minimum number of tickets sold for that specific date, determining a specific range.
- Checkout Overview: Depending on the date range you choose (top left), you will see some checkout information below:
- Average items per order: How many products are your visitors purchasing per order.
- Average order value: How much revenue is coming in an average per order.
- Checkout Conversion Rate: From the people who open the Check-Out, what percentage places an order.
- Website Conversion Rate: From the people who visit your website, what percentage places an order.
- Products sold: A pie chart showing the percentage of products sold.
- Checkout Conversion Rate per channel: Shows you which are the channels that are converting your visitors best.
- Sales/Revenue Overview: A chart where you will see a summary of revenue per product.
Sales Report (new)
Does this Sales report (new) replace the Sales Report?
For now - No! The Sales Report (new) provides in-depth details about individual transactions for your sold products. Additionally, it includes information on your Point of Sales (POS) transactions.
We recommend using both the Sales Report and Sales Report (new). Eventually, we will merge both reports into a single comprehensive report, making it easier for you to access all the necessary information in one place. Once the information on both reports is available in one - you'll hear from us!
Make sure you give the full guide a read to make the most out of your findings.
Settlement Report
- Make sure you give the full guide a read to make the most out of your findings.
- Watch back our webinar and learn how to navigate the upgraded Settlement Report
Forecast Report
👉 How to use your forecast report
Seeing your potential future does not need to involve a crystal ball anymore!
With your forecast report, you can now look ahead to see the expected minimum and maximum sold tickets, your current sales numbers, and the weather forecast, which can have an immense influence on whether you reach the forecasted numbers.
Further, you can also review the past week and/or month.
To access the forecasting report in your Control Panel, please keep the following in mind:
In our forecasting procedure, we take into account both dated single-visit tickets and reservations to predict the daily number of visitors.
- A reliable forecast requires a minimum of 50 visitors per day.
- A short-term forecast (7 days) is generated with a minimum of 28 days of data,
- A long-term forecast (4 weeks) requires at least 3 months of visitor data.
Make sure you give the full guide a read to make the most out of your findings.
Sales Report
In this report, you will see all the relevant information regarding your venue’s revenue and sales information. When checking the sales report, you will see the number of products sold, while the revenue report will show you actual revenue. The dashboards you will find in both reports are:
- Total revenue/sales report: With a graph of the monthly revenue/ sales up to date.
- Revenue/ sales per product: Your revenue/sales corresponding to specific products.
- Revenue/sales per device: Was the purchase made from a mobile device or a desktop?
- Revenue/sales per acquisition channel: Which digital channel is bringing the most revenue/sales? This information can help you optimize your advertising budget.
- Revenue/sales per payment type (method): Are your orders made using a credit card, PayPal, or any other payment type you have associated with your Convious ticket shop?
Make sure you give the full guide a read to make the most out of your findings.
Pricing Report
If you are using any type of dynamic pricing, whether this is rule-based pricing, Name Your Own Price or Real-time pricing, you naturally would want to keep track of your pricing and its evolution to understand its impact on your revenue and also your expected sales.
Make sure you give the full guide a read to make the most out of your findings.
Traffic Report
Here you will be able to get actionable insights regarding your website traffic. This report could be particularly useful for your marketing team or to optimize your marketing efforts. In this report you will find:
- Total website traffic per day
- New vs. Returning visitors
- Acquisition channel
- Popular days on your website
- Popular hours on your website
Make sure you give the full guide a read to make the most out of your findings.
Customers Report
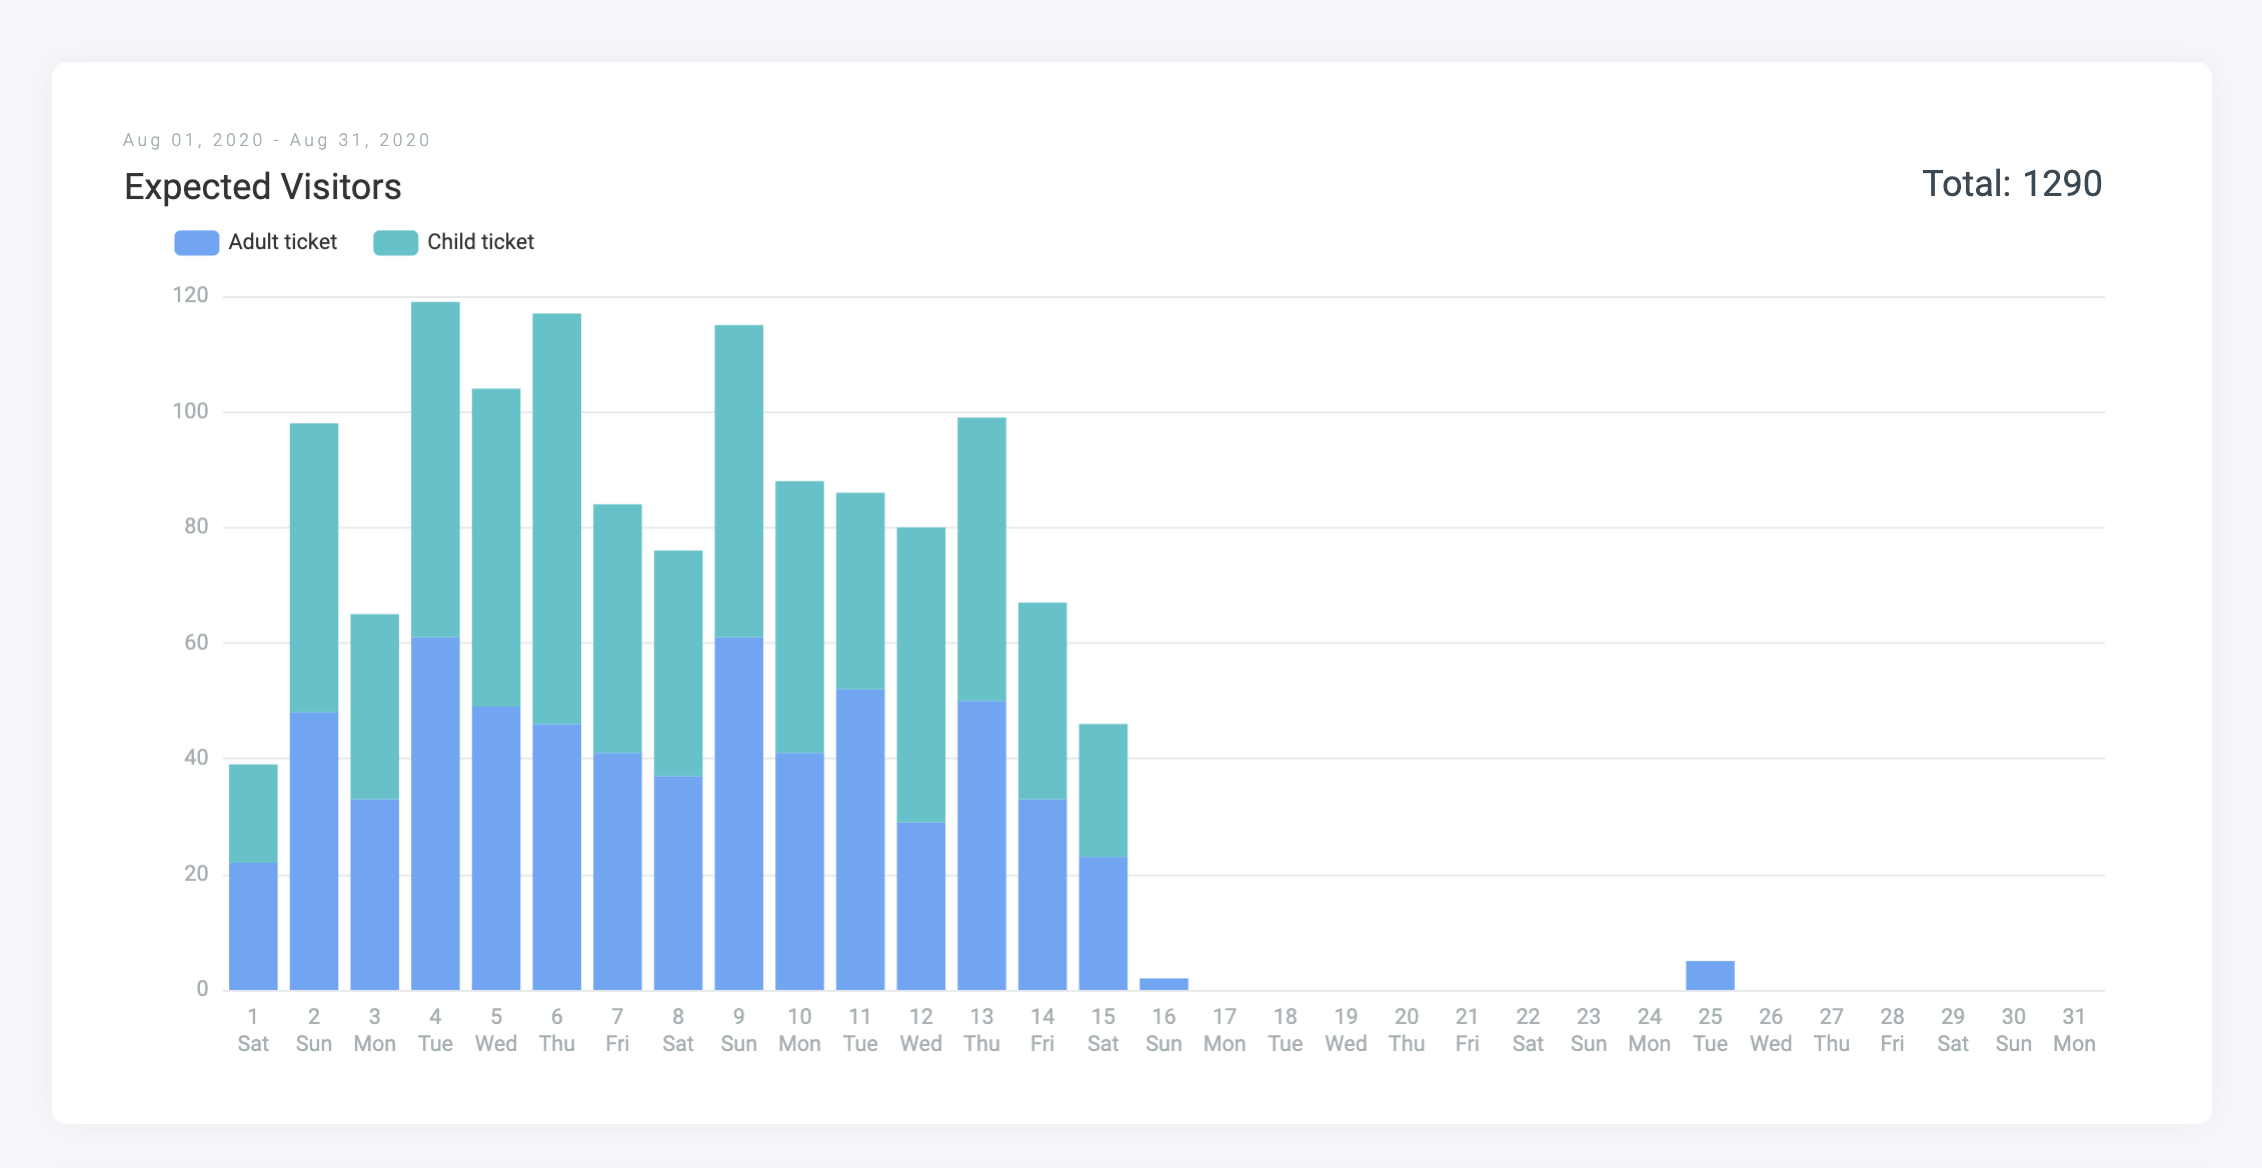
Here you will be able to keep track of the customers expected to visit your venue each day. It is dedicated to informing you about expected visitors and upsells to be redeemed on a given date, based on your dated products sold. You can always use the date picker to explore specific date ranges.
Here you will find:
- Expected visitors based on the type of product they bought per day
- Expected upsells based on the type of upsell products your customers bought per day
Remember, if you hover over the data, you will get a specific chart with a more detailed overview.
Make sure you give the full guide a read to make the most out of your findings.
Emails Report
Emails report shows you data over email interactions sent to your clients via Convious. From transactional emails like ‘Order Confirmation,’ to marketing emails, you find a summary of how your customers are interacting with your emails. Here you will find relevant data such as:
- Email click per country
- Top email providers
- A summary of your Marketing Emails, showing the percentage of sent emails, delivered emails, opened emails, clicks, bounces, unsubscribed, and converted customers.
- A summary of your Transactional Emails, showing the percentage of sent emails, delivered emails, opened emails, clicks, and bounces.
Make sure you give the full guide a read to make the most out of your findings.
Barcode Report
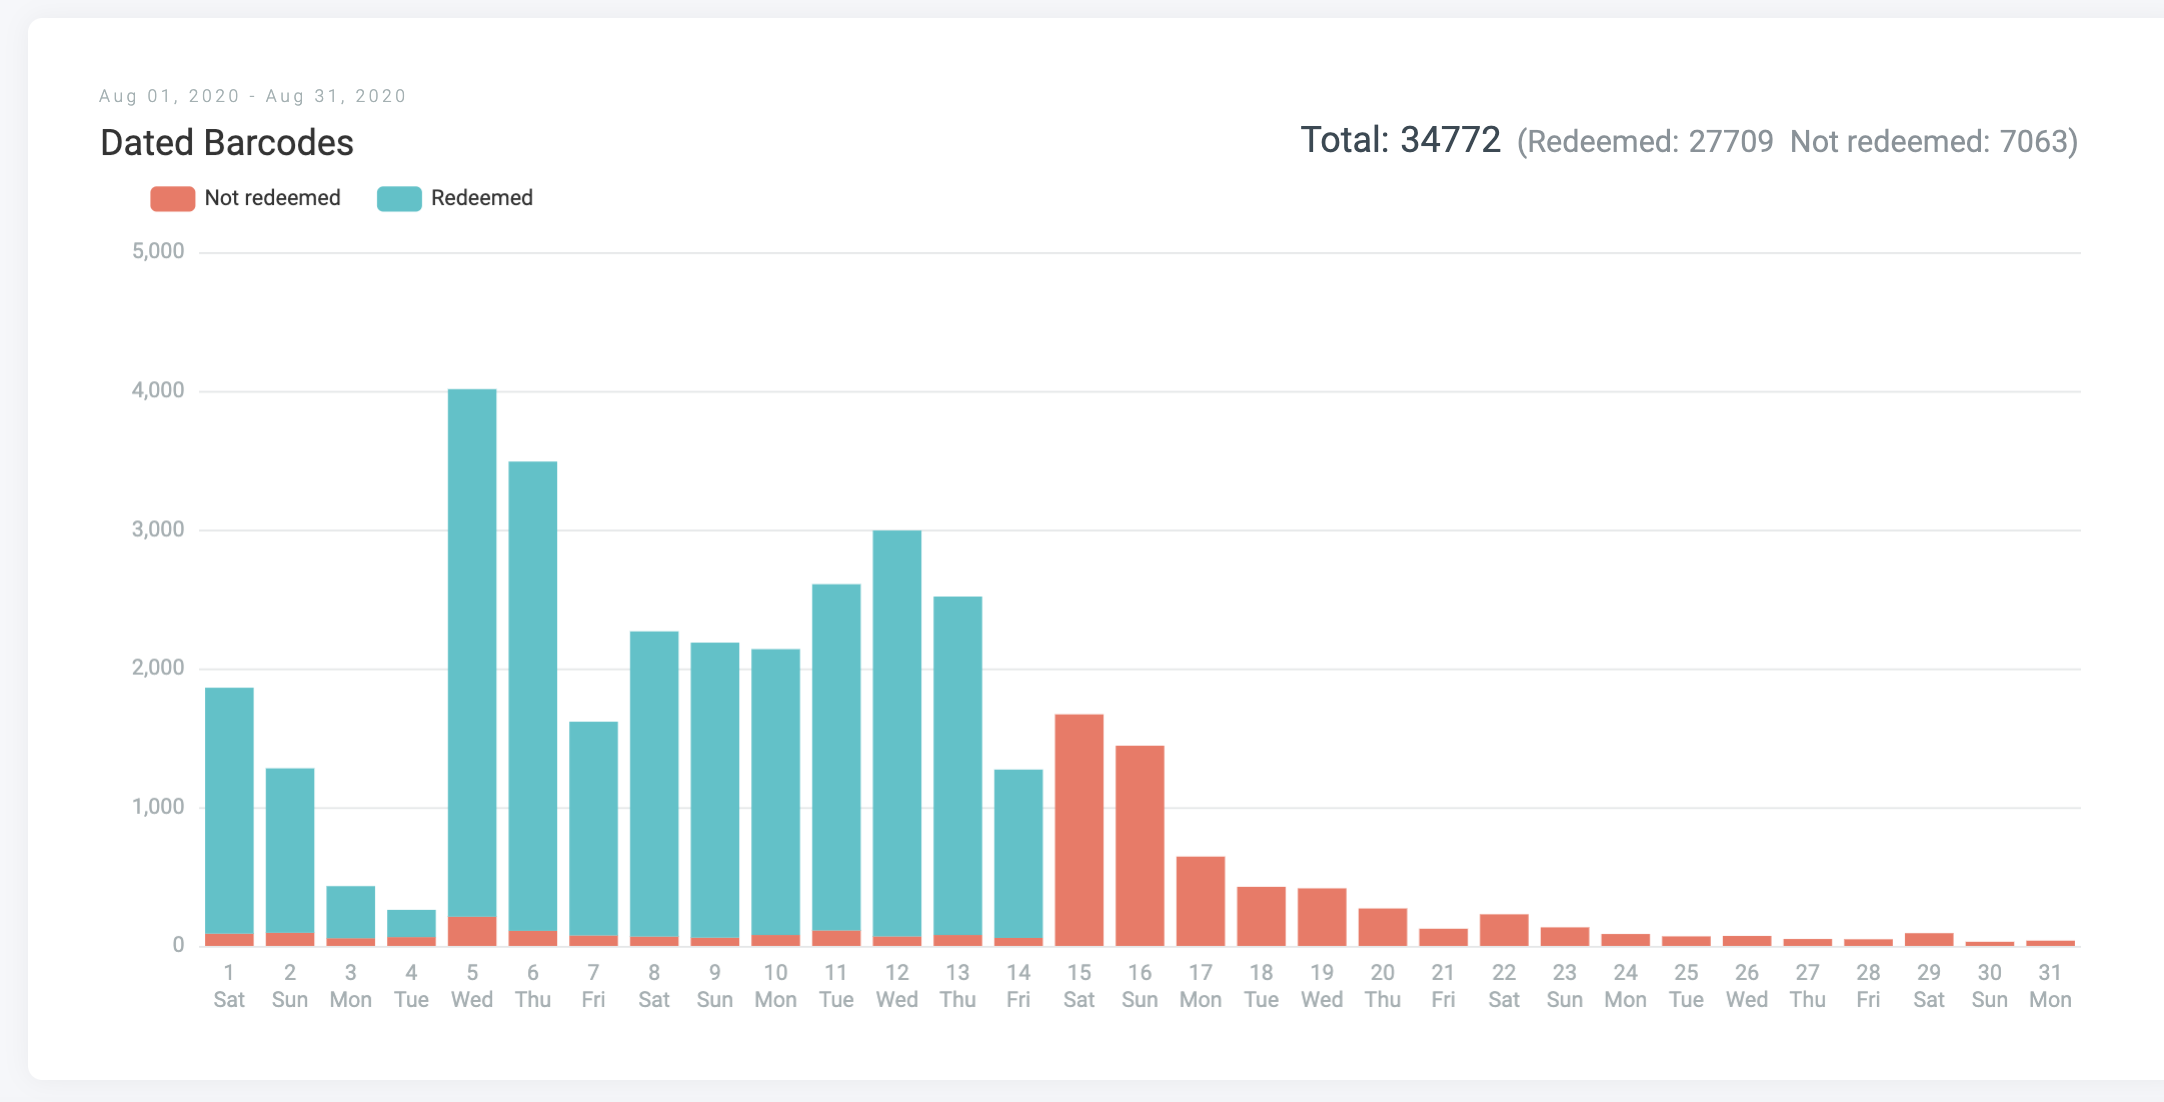
In this report, you will be able to see a general overview of Redeemed vs. Not redeemed barcodes. You will see two dashboards:
Redeemed vs. Not Redeemed Dated Barcodes
Redeemed Undated Barcodes
This can help you, and the algorithm, to determine the number of no-shows which will help to further optimize forecasts.
Discount Codes Report
👉 How to use your Discount Code Report
The usage of discounts, either via Coupons or Vouchers, is an important part of your customer acquisition and retention and thus be accurately monitored and understood.
Always keep a clear overview of:
- Redeemed codes
- Collected revenue vs. the original value of the tickets sold
- The average order value with codes and without codes
and much more.
Answer questions such as:
- Are all codes of this campaign used?
- Which campaign is the most successful?
- Are we increasing or decreasing order value, cart size or revenue using discount codes?
and many more.
Make sure you give the full guide a read to make the most out of your findings.
Engage Tools Report
👉 How to use your Engage Tools Report
As you already know, your Engagement tools are a vital part of your Convious platform. Their task is to successfully attract your visitors' attention and steer them towards purchasing via your website. Here you will be able to see how your three engagement tools are performing based on:
- Views
- Unique Views
- Unique clicks
- CTR
- Conversions
- Revenue generated
Make sure you give the full guide a read to make the most out of your findings.
App Push Notifications Report
👉 How to use your Push notifications report
Your Tap App is your direct communication stream to your visitors and fans - now you can utilise it like never before by sending push notifications straight from your Control Panel.
At the top of your report you can see:
- App users opted-in This metric indicates the number of App users who have been granted permission to receive push notifications. These are individuals who have explicitly chosen to stay engaged with your app's updates.
- Sent push notifications: This metric informs you of the total number of messages that have been sent during the specified time period. It provides an overview of the volume of notifications that have been pushed out to your user base.
- Opened push notifications: This metric reveals the number of push notifications that have been opened by your App users. It helps gauge the effectiveness of your messages and the level of engagement they generate.
- Clicked push notifications: This metric represents the total number of push notifications that users have clicked on. It measures the success of your messages in driving users to take further action, such as visiting a specific page or engaging with a particular feature.
Make sure you give the full guide a read to make the most out of your findings.
Time to practice!
Check which product has been sold the most for the past week.
Check which engagement tool is generating more revenue.
Check how many barcodes have been redeemed today.
Check how many visitors you are expecting today.
Check how many people are visiting your website daily.
Check yourself
- Do you know what is the difference between a Sales Report and a Revenue Report?
- Do you know how to read the Visitors Forecast Report?
- Do you know how to evaluate your website’s performance?
- Do you know how to evaluate your barcode status?
- Do you know how to evaluate the performance of your emails?
If you answered all of the above with“yes,” congratulations, you have just finished the six lessons into dominating the Fundamentals of your Convious Control Panel!


